Syrian vs Korean Child Poverty Under the Age of 5

COMPARE

Syrian
Race
Ancestry
AfghanAfricanAlaska NativeAlaskan AthabascanAlbanianAleutAlsatianAmericanApacheArabArapahoArgentineanArmenianAssyrian/Chaldean/SyriacAustralianAustrianBahamianBangladeshiBarbadianBasqueBelgianBelizeanBermudanBhutaneseBlackfeetBolivianBrazilianBritishBritish West IndianBulgarianBurmeseCajunCambodianCanadianCape VerdeanCarpatho RusynCelticCentral AmericanCentral American IndianCherokeeCheyenneChickasawChileanChineseChippewaChoctawColombianColvilleComancheCosta RicanCreeCreekCroatianCrowCubanCypriotCzechCzechoslovakianDanishDelawareDominicanDutchDutch West IndianEastern EuropeanEcuadorianEgyptianEnglishEstonianEthiopianEuropeanFijianFilipinoFinnishFrenchFrench American IndianFrench CanadianGermanGerman RussianGhanaianGreekGuamanian/ChamorroGuatemalanGuyaneseHaitianHmongHonduranHopiHoumaHungarianIcelanderIndian (Asian)IndonesianInupiatIranianIraqiIrishIroquoisIsraeliItalianJamaicanJapaneseJordanianKenyanKiowaLaotianLatvianLebaneseLiberianLithuanianLumbeeLuxembourgerMacedonianMalaysianMalteseMarshalleseMenomineeMexicanMexican American IndianMongolianMoroccanNative HawaiianNavajoNepaleseNew ZealanderNicaraguanNigerianNorthern EuropeanNorwegianOkinawanOsageOttawaPaiutePakistaniPalestinianPanamanianParaguayanPennsylvania GermanPeruvianPimaPolishPortuguesePotawatomiPuebloPuerto RicanPuget Sound SalishRomanianRussianSalvadoranSamoanScandinavianScotch-IrishScottishSeminoleSenegaleseSerbianShoshoneSierra LeoneanSiouxSlavicSlovakSloveneSomaliSouth AfricanSouth AmericanSouth American IndianSoviet UnionSpaniardSpanishSpanish AmericanSpanish American IndianSri LankanSubsaharan AfricanSudaneseSwedishSwissSyrianTaiwaneseThaiTlingit-HaidaTohono O'OdhamTonganTrinidadian and TobagonianTsimshianTurkishU.S. Virgin IslanderUgandanUkrainianUruguayanUteVenezuelanVietnameseWelshWest IndianYakamaYaquiYugoslavianYumanYup'ikZimbabwean
Immigration
NonimmigrantsImmigrantsAfghanistanAfricaAlbaniaArgentinaArmeniaAsiaAustraliaAustriaBahamasBangladeshBarbadosBelarusBelgiumBelizeBoliviaBosnia and HerzegovinaBrazilBulgariaBurma/MyanmarCabo VerdeCambodiaCameroonCanadaCaribbeanCentral AmericaChileChinaColombiaCongoCosta RicaCroatiaCubaCzechoslovakiaDenmarkDominicaDominican RepublicEastern AfricaEastern AsiaEastern EuropeEcuadorEgyptEl SalvadorEnglandEritreaEthiopiaEuropeFijiFranceGermanyGhanaGreeceGrenadaGuatemalaGuyanaHaitiHondurasHong KongHungaryIndiaIndonesiaIranIraqIrelandIsraelItalyJamaicaJapanJordanKazakhstanKenyaKoreaKuwaitLaosLatin AmericaLatviaLebanonLiberiaLithuaniaMalaysiaMexicoMicronesiaMiddle AfricaMoldovaMoroccoNepalNetherlandsNicaraguaNigeriaNorth AmericaNorth MacedoniaNorthern AfricaNorthern EuropeNorwayOceaniaPakistanPanamaPeruPhilippinesPolandPortugalRomaniaRussiaSaudi ArabiaScotlandSenegalSerbiaSierra LeoneSingaporeSomaliaSouth AfricaSouth AmericaSouth Central AsiaSouth Eastern AsiaSouthern EuropeSpainSri LankaSt. Vincent and the GrenadinesSudanSwedenSwitzerlandSyriaTaiwanThailandTrinidad and TobagoTurkeyUgandaUkraineUruguayUzbekistanVenezuelaVietnamWest IndiesWestern AfricaWestern AsiaWestern EuropeYemenZaireZimbabweAzores
Korean
Race
Ancestry
AfghanAfricanAlaska NativeAlaskan AthabascanAlbanianAleutAlsatianAmericanApacheArabArapahoArgentineanArmenianAssyrian/Chaldean/SyriacAustralianAustrianBahamianBangladeshiBarbadianBasqueBelgianBelizeanBermudanBhutaneseBlackfeetBolivianBrazilianBritishBritish West IndianBulgarianBurmeseCajunCambodianCanadianCape VerdeanCarpatho RusynCelticCentral AmericanCentral American IndianCherokeeCheyenneChickasawChileanChineseChippewaChoctawColombianColvilleComancheCosta RicanCreeCreekCroatianCrowCubanCypriotCzechCzechoslovakianDanishDelawareDominicanDutchDutch West IndianEastern EuropeanEcuadorianEgyptianEnglishEstonianEthiopianEuropeanFijianFilipinoFinnishFrenchFrench American IndianFrench CanadianGermanGerman RussianGhanaianGreekGuamanian/ChamorroGuatemalanGuyaneseHaitianHmongHonduranHopiHoumaHungarianIcelanderIndian (Asian)IndonesianInupiatIranianIraqiIrishIroquoisIsraeliItalianJamaicanJapaneseJordanianKenyanKiowaKoreanLaotianLatvianLebaneseLiberianLithuanianLumbeeLuxembourgerMacedonianMalaysianMalteseMarshalleseMenomineeMexicanMexican American IndianMongolianMoroccanNative HawaiianNavajoNepaleseNew ZealanderNicaraguanNigerianNorthern EuropeanNorwegianOkinawanOsageOttawaPaiutePakistaniPalestinianPanamanianParaguayanPennsylvania GermanPeruvianPimaPolishPortuguesePotawatomiPuebloPuerto RicanPuget Sound SalishRomanianRussianSalvadoranSamoanScandinavianScotch-IrishScottishSeminoleSenegaleseSerbianShoshoneSierra LeoneanSiouxSlavicSlovakSloveneSomaliSouth AfricanSouth AmericanSouth American IndianSoviet UnionSpaniardSpanishSpanish AmericanSpanish American IndianSri LankanSubsaharan AfricanSudaneseSwedishSwissTaiwaneseThaiTlingit-HaidaTohono O'OdhamTonganTrinidadian and TobagonianTsimshianTurkishU.S. Virgin IslanderUgandanUkrainianUruguayanUteVenezuelanVietnameseWelshWest IndianYakamaYaquiYugoslavianYumanYup'ikZimbabwean
Immigration
NonimmigrantsImmigrantsAfghanistanAfricaAlbaniaArgentinaArmeniaAsiaAustraliaAustriaBahamasBangladeshBarbadosBelarusBelgiumBelizeBoliviaBosnia and HerzegovinaBrazilBulgariaBurma/MyanmarCabo VerdeCambodiaCameroonCanadaCaribbeanCentral AmericaChileChinaColombiaCongoCosta RicaCroatiaCubaCzechoslovakiaDenmarkDominicaDominican RepublicEastern AfricaEastern AsiaEastern EuropeEcuadorEgyptEl SalvadorEnglandEritreaEthiopiaEuropeFijiFranceGermanyGhanaGreeceGrenadaGuatemalaGuyanaHaitiHondurasHong KongHungaryIndiaIndonesiaIranIraqIrelandIsraelItalyJamaicaJapanJordanKazakhstanKenyaKoreaKuwaitLaosLatin AmericaLatviaLebanonLiberiaLithuaniaMalaysiaMexicoMicronesiaMiddle AfricaMoldovaMoroccoNepalNetherlandsNicaraguaNigeriaNorth AmericaNorth MacedoniaNorthern AfricaNorthern EuropeNorwayOceaniaPakistanPanamaPeruPhilippinesPolandPortugalRomaniaRussiaSaudi ArabiaScotlandSenegalSerbiaSierra LeoneSingaporeSomaliaSouth AfricaSouth AmericaSouth Central AsiaSouth Eastern AsiaSouthern EuropeSpainSri LankaSt. Vincent and the GrenadinesSudanSwedenSwitzerlandSyriaTaiwanThailandTrinidad and TobagoTurkeyUgandaUkraineUruguayUzbekistanVenezuelaVietnamWest IndiesWestern AfricaWestern AsiaWestern EuropeYemenZaireZimbabweAzores
Child Poverty Under the Age of 5
Income
Poverty
Unemployment
Labor Participation
Family Structure
Vehicle Availability
Education Level
Disability

Child Poverty Under the Age of 5 Comparison

Syrians

Koreans

Good
Exceptional
16.6%
CHILD POVERTY UNDER THE AGE OF 5
79.1/ 100
METRIC RATING
148th/ 347
METRIC RANK
14.4%
CHILD POVERTY UNDER THE AGE OF 5
99.8/ 100
METRIC RATING
31st/ 347
METRIC RANK

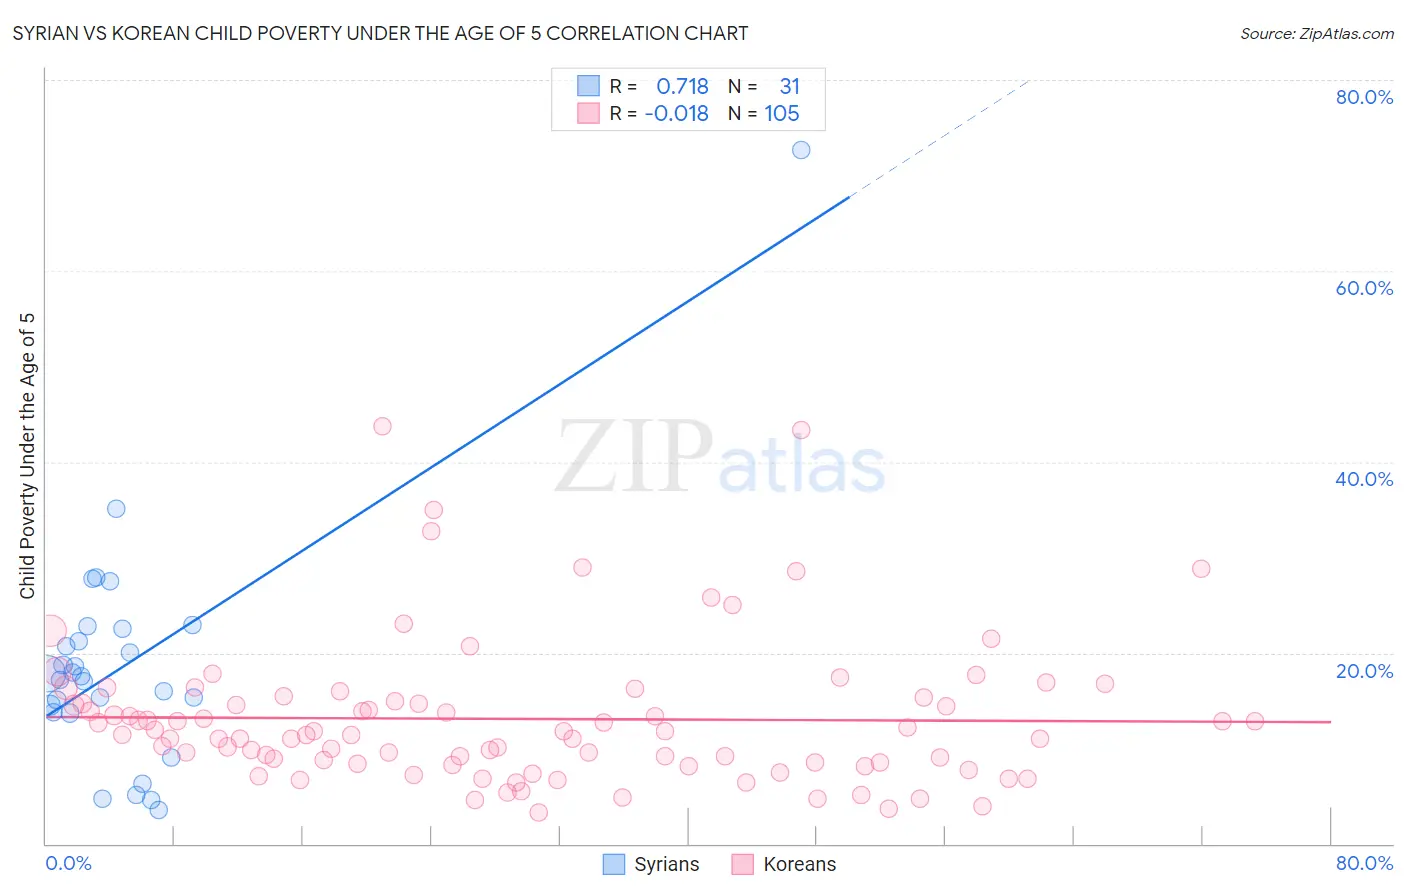
Syrian vs Korean Child Poverty Under the Age of 5 Correlation Chart

The statistical analysis conducted on geographies consisting of 256,842,692 people shows a strong positive correlation between the proportion of Syrians and poverty level among children under the age of 5 in the United States with a correlation coefficient (R) of 0.718 and weighted average of 16.6%. Similarly, the statistical analysis conducted on geographies consisting of 483,948,585 people shows no correlation between the proportion of Koreans and poverty level among children under the age of 5 in the United States with a correlation coefficient (R) of -0.018 and weighted average of 14.4%, a difference of 15.5%.
Syrian vs Korean Child Poverty Under the Age of 5

Child Poverty Under the Age of 5 Correlation Summary

MeasurementSyrianKorean
Minimum3.5%3.3%
Maximum72.7%43.8%
Range69.2%40.5%
Mean18.8%13.1%
Median17.5%11.4%
Interquartile 25% (IQ1)13.8%8.5%
Interquartile 75% (IQ3)22.5%15.2%
Interquartile Range (IQR)8.7%6.7%
Standard Deviation (Sample)12.5%7.5%
Standard Deviation (Population)12.3%7.5%

Similar Demographics by Child Poverty Under the Age of 5

Demographics Similar to Syrians by Child Poverty Under the Age of 5

In terms of child poverty under the age of 5, the demographic groups most similar to Syrians are New Zealander (16.6%, a difference of 0.060%), Immigrants from Nepal (16.6%, a difference of 0.19%), Colombian (16.7%, a difference of 0.20%), Canadian (16.7%, a difference of 0.23%), and Belgian (16.7%, a difference of 0.30%).
DemographicsRating | RankChild Poverty Under the Age of 5
Immigrants | Western Europe
83.3
/100
|
#141
Excellent
16.5%
Portuguese
83.0
/100
|
#142
Excellent
16.5%
Samoans
83.0
/100
|
#143
Excellent
16.5%
Ethiopians
82.7
/100
|
#144
Excellent
16.5%
Immigrants | Ethiopia
82.1
/100
|
#145
Excellent
16.6%
Israelis
82.0
/100
|
#146
Excellent
16.6%
Immigrants | Nepal
80.3
/100
|
#147
Excellent
16.6%
Syrians
79.1
/100
|
#148
Good
16.6%
New Zealanders
78.7
/100
|
#149
Good
16.6%
Colombians
77.8
/100
|
#150
Good
16.7%
Canadians
77.6
/100
|
#151
Good
16.7%
Belgians
77.2
/100
|
#152
Good
16.7%
Dutch
77.1
/100
|
#153
Good
16.7%
Immigrants | Venezuela
76.0
/100
|
#154
Good
16.7%
South Americans
75.1
/100
|
#155
Good
16.7%

Demographics Similar to Koreans by Child Poverty Under the Age of 5

In terms of child poverty under the age of 5, the demographic groups most similar to Koreans are Cambodian (14.4%, a difference of 0.030%), Immigrants from Asia (14.4%, a difference of 0.080%), Immigrants from Sri Lanka (14.4%, a difference of 0.28%), Immigrants from Indonesia (14.3%, a difference of 0.47%), and Taiwanese (14.5%, a difference of 0.58%).
DemographicsRating | RankChild Poverty Under the Age of 5
Asians
99.9
/100
|
#24
Exceptional
14.0%
Cypriots
99.9
/100
|
#25
Exceptional
14.0%
Immigrants | Lithuania
99.9
/100
|
#26
Exceptional
14.1%
Tongans
99.9
/100
|
#27
Exceptional
14.2%
Immigrants | Indonesia
99.8
/100
|
#28
Exceptional
14.3%
Immigrants | Asia
99.8
/100
|
#29
Exceptional
14.4%
Cambodians
99.8
/100
|
#30
Exceptional
14.4%
Koreans
99.8
/100
|
#31
Exceptional
14.4%
Immigrants | Sri Lanka
99.8
/100
|
#32
Exceptional
14.4%
Taiwanese
99.8
/100
|
#33
Exceptional
14.5%
Immigrants | Moldova
99.8
/100
|
#34
Exceptional
14.5%
Latvians
99.8
/100
|
#35
Exceptional
14.5%
Maltese
99.8
/100
|
#36
Exceptional
14.5%
Turks
99.7
/100
|
#37
Exceptional
14.6%
Eastern Europeans
99.7
/100
|
#38
Exceptional
14.6%