Syrian vs Colombian Poverty
COMPARE
Syrian
Colombian
Poverty
Poverty Comparison
Syrians
Colombians
12.0%
POVERTY
75.1/ 100
METRIC RATING
145th/ 347
METRIC RANK
12.2%
POVERTY
57.8/ 100
METRIC RATING
164th/ 347
METRIC RANK
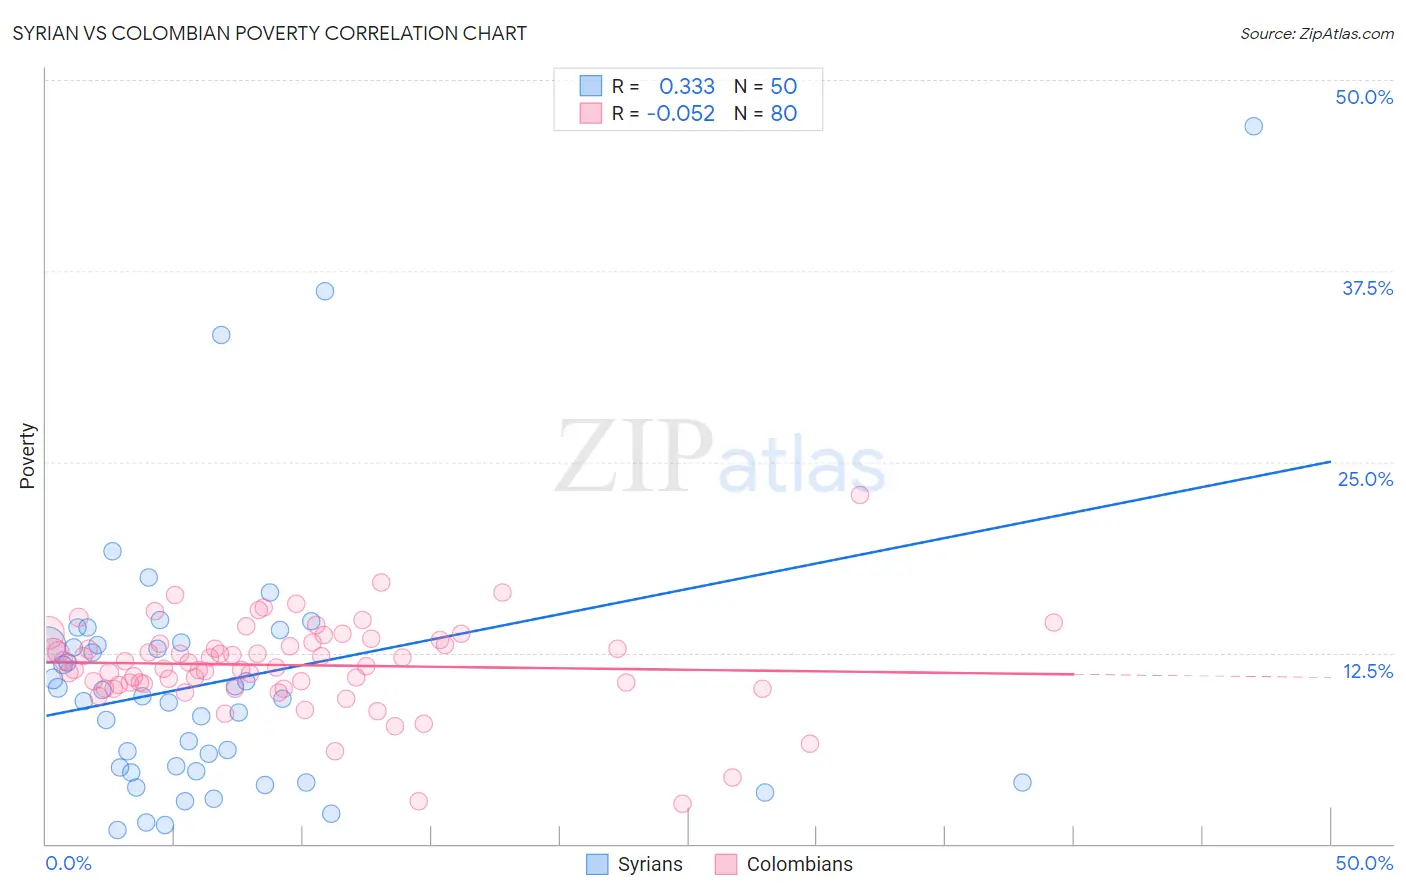
Syrian vs Colombian Poverty Correlation Chart
The statistical analysis conducted on geographies consisting of 266,206,750 people shows a mild positive correlation between the proportion of Syrians and poverty level in the United States with a correlation coefficient (R) of 0.333 and weighted average of 12.0%. Similarly, the statistical analysis conducted on geographies consisting of 419,330,126 people shows a slight negative correlation between the proportion of Colombians and poverty level in the United States with a correlation coefficient (R) of -0.052 and weighted average of 12.2%, a difference of 2.0%.
Poverty Correlation Summary
| Measurement | Syrian | Colombian |
| Minimum | 0.89% | 2.6% |
| Maximum | 47.0% | 22.8% |
| Range | 46.1% | 20.2% |
| Mean | 10.6% | 11.7% |
| Median | 9.6% | 11.7% |
| Interquartile 25% (IQ1) | 4.8% | 10.5% |
| Interquartile 75% (IQ3) | 13.0% | 13.1% |
| Interquartile Range (IQR) | 8.3% | 2.7% |
| Standard Deviation (Sample) | 8.7% | 3.0% |
| Standard Deviation (Population) | 8.6% | 3.0% |
Demographics Similar to Syrians and Colombians by Poverty
In terms of poverty, the demographic groups most similar to Syrians are Afghan (12.0%, a difference of 0.030%), Immigrants from Bosnia and Herzegovina (12.0%, a difference of 0.19%), Immigrants from Germany (12.0%, a difference of 0.31%), Immigrants from Malaysia (12.0%, a difference of 0.32%), and Immigrants from Kazakhstan (12.0%, a difference of 0.37%). Similarly, the demographic groups most similar to Colombians are Immigrants from Ethiopia (12.2%, a difference of 0.070%), Ethiopian (12.2%, a difference of 0.12%), Immigrants from Fiji (12.2%, a difference of 0.13%), Immigrants from Nepal (12.2%, a difference of 0.26%), and Pennsylvania German (12.2%, a difference of 0.31%).
| Demographics | Rating | Rank | Poverty |
| Icelanders | 77.9 /100 | #144 | Good 11.9% |
| Syrians | 75.1 /100 | #145 | Good 12.0% |
| Afghans | 74.9 /100 | #146 | Good 12.0% |
| Immigrants | Bosnia and Herzegovina | 73.7 /100 | #147 | Good 12.0% |
| Immigrants | Germany | 72.7 /100 | #148 | Good 12.0% |
| Immigrants | Malaysia | 72.7 /100 | #149 | Good 12.0% |
| Immigrants | Kazakhstan | 72.3 /100 | #150 | Good 12.0% |
| Samoans | 71.9 /100 | #151 | Good 12.0% |
| Armenians | 67.6 /100 | #152 | Good 12.1% |
| Immigrants | Northern Africa | 63.9 /100 | #153 | Good 12.1% |
| Guamanians/Chamorros | 63.9 /100 | #154 | Good 12.1% |
| Hungarians | 63.6 /100 | #155 | Good 12.2% |
| Scotch-Irish | 62.6 /100 | #156 | Good 12.2% |
| Costa Ricans | 62.2 /100 | #157 | Good 12.2% |
| Taiwanese | 61.8 /100 | #158 | Good 12.2% |
| Pennsylvania Germans | 60.8 /100 | #159 | Good 12.2% |
| Immigrants | Nepal | 60.4 /100 | #160 | Good 12.2% |
| Immigrants | Fiji | 59.1 /100 | #161 | Average 12.2% |
| Ethiopians | 59.1 /100 | #162 | Average 12.2% |
| Immigrants | Ethiopia | 58.6 /100 | #163 | Average 12.2% |
| Colombians | 57.8 /100 | #164 | Average 12.2% |