Sioux vs Immigrants from Egypt Single Female Poverty
COMPARE
Sioux
Immigrants from Egypt
Single Female Poverty
Single Female Poverty Comparison
Sioux
Immigrants from Egypt
31.3%
SINGLE FEMALE POVERTY
0.0/ 100
METRIC RATING
341st/ 347
METRIC RANK
19.2%
SINGLE FEMALE POVERTY
99.6/ 100
METRIC RATING
67th/ 347
METRIC RANK
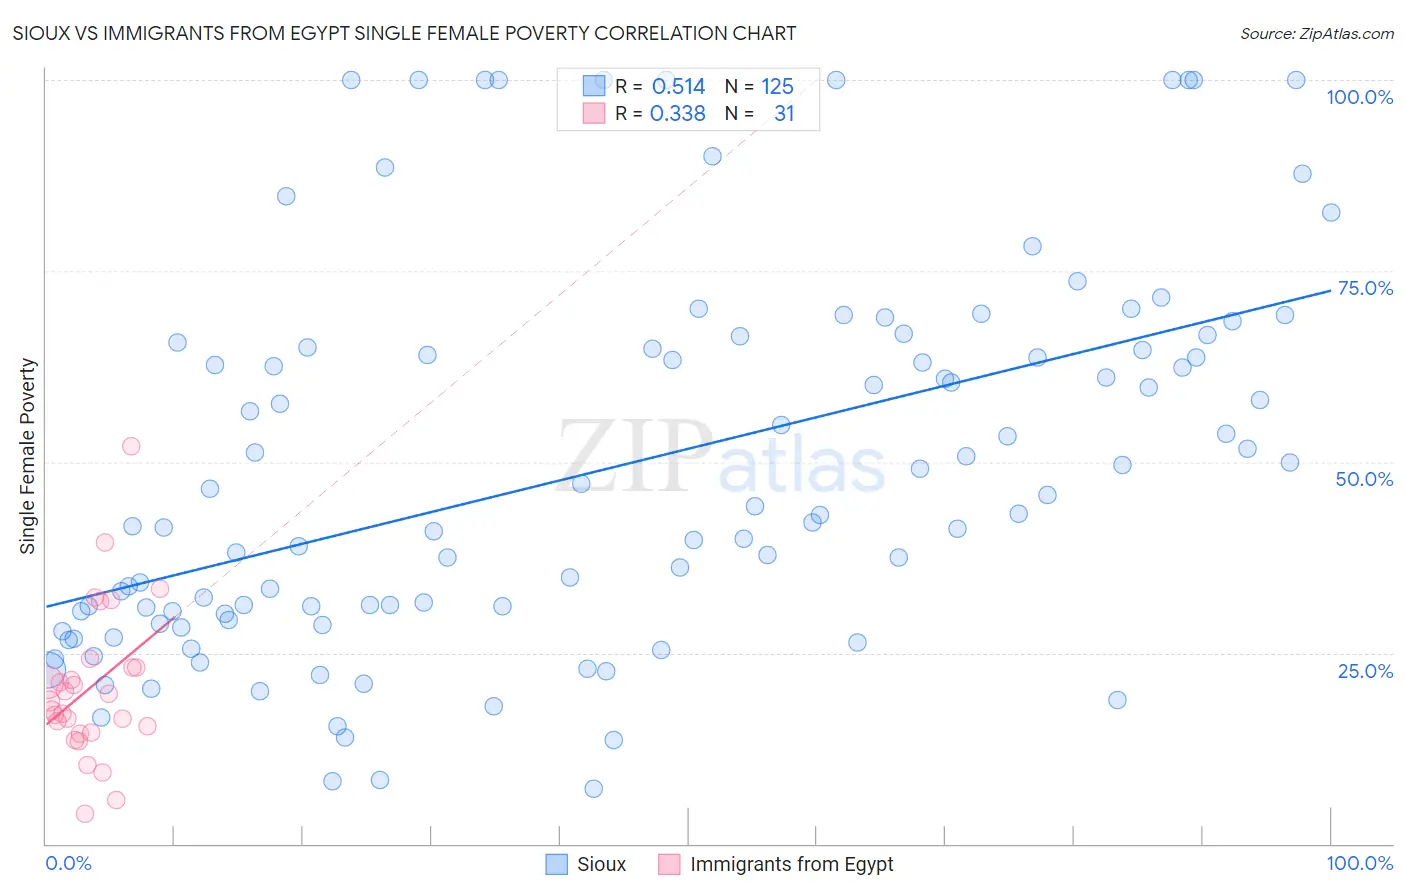
Sioux vs Immigrants from Egypt Single Female Poverty Correlation Chart
The statistical analysis conducted on geographies consisting of 232,047,098 people shows a substantial positive correlation between the proportion of Sioux and poverty level among single females in the United States with a correlation coefficient (R) of 0.514 and weighted average of 31.3%. Similarly, the statistical analysis conducted on geographies consisting of 243,038,717 people shows a mild positive correlation between the proportion of Immigrants from Egypt and poverty level among single females in the United States with a correlation coefficient (R) of 0.338 and weighted average of 19.2%, a difference of 62.4%.
Single Female Poverty Correlation Summary
| Measurement | Sioux | Immigrants from Egypt |
| Minimum | 7.1% | 3.9% |
| Maximum | 100.0% | 52.0% |
| Range | 92.9% | 48.1% |
| Mean | 49.1% | 20.5% |
| Median | 43.3% | 18.7% |
| Interquartile 25% (IQ1) | 29.7% | 14.6% |
| Interquartile 75% (IQ3) | 64.9% | 23.1% |
| Interquartile Range (IQR) | 35.2% | 8.4% |
| Standard Deviation (Sample) | 24.8% | 9.9% |
| Standard Deviation (Population) | 24.7% | 9.7% |
Similar Demographics by Single Female Poverty
Demographics Similar to Sioux by Single Female Poverty
In terms of single female poverty, the demographic groups most similar to Sioux are Navajo (31.7%, a difference of 1.3%), Cajun (30.6%, a difference of 2.0%), Cheyenne (30.4%, a difference of 2.8%), Pima (30.3%, a difference of 3.0%), and Crow (32.4%, a difference of 3.7%).
| Demographics | Rating | Rank | Single Female Poverty |
| Ute | 0.0 /100 | #333 | Tragic 28.4% |
| Pueblo | 0.0 /100 | #334 | Tragic 28.6% |
| Immigrants | Yemen | 0.0 /100 | #335 | Tragic 28.9% |
| Colville | 0.0 /100 | #336 | Tragic 29.1% |
| Yuman | 0.0 /100 | #337 | Tragic 29.4% |
| Pima | 0.0 /100 | #338 | Tragic 30.3% |
| Cheyenne | 0.0 /100 | #339 | Tragic 30.4% |
| Cajuns | 0.0 /100 | #340 | Tragic 30.6% |
| Sioux | 0.0 /100 | #341 | Tragic 31.3% |
| Navajo | 0.0 /100 | #342 | Tragic 31.7% |
| Crow | 0.0 /100 | #343 | Tragic 32.4% |
| Lumbee | 0.0 /100 | #344 | Tragic 33.0% |
| Houma | 0.0 /100 | #345 | Tragic 33.8% |
| Puerto Ricans | 0.0 /100 | #346 | Tragic 34.1% |
| Tohono O'odham | 0.0 /100 | #347 | Tragic 34.2% |
Demographics Similar to Immigrants from Egypt by Single Female Poverty
In terms of single female poverty, the demographic groups most similar to Immigrants from Egypt are Palestinian (19.2%, a difference of 0.040%), Laotian (19.3%, a difference of 0.040%), Cypriot (19.2%, a difference of 0.060%), Immigrants from Europe (19.2%, a difference of 0.080%), and Immigrants from Northern Europe (19.2%, a difference of 0.090%).
| Demographics | Rating | Rank | Single Female Poverty |
| Russians | 99.6 /100 | #60 | Exceptional 19.2% |
| Cambodians | 99.6 /100 | #61 | Exceptional 19.2% |
| Lithuanians | 99.6 /100 | #62 | Exceptional 19.2% |
| Immigrants | Northern Europe | 99.6 /100 | #63 | Exceptional 19.2% |
| Immigrants | Europe | 99.6 /100 | #64 | Exceptional 19.2% |
| Cypriots | 99.6 /100 | #65 | Exceptional 19.2% |
| Palestinians | 99.6 /100 | #66 | Exceptional 19.2% |
| Immigrants | Egypt | 99.6 /100 | #67 | Exceptional 19.2% |
| Laotians | 99.5 /100 | #68 | Exceptional 19.3% |
| Paraguayans | 99.5 /100 | #69 | Exceptional 19.3% |
| Immigrants | Jordan | 99.4 /100 | #70 | Exceptional 19.3% |
| Immigrants | South Eastern Asia | 99.4 /100 | #71 | Exceptional 19.3% |
| Immigrants | Latvia | 99.4 /100 | #72 | Exceptional 19.3% |
| Immigrants | Peru | 99.4 /100 | #73 | Exceptional 19.3% |
| Immigrants | Belarus | 99.4 /100 | #74 | Exceptional 19.3% |