Syrian vs Immigrants from Saudi Arabia Female Poverty

COMPARE

Syrian
Race
Ancestry
AfghanAfricanAlaska NativeAlaskan AthabascanAlbanianAleutAlsatianAmericanApacheArabArapahoArgentineanArmenianAssyrian/Chaldean/SyriacAustralianAustrianBahamianBangladeshiBarbadianBasqueBelgianBelizeanBermudanBhutaneseBlackfeetBolivianBrazilianBritishBritish West IndianBulgarianBurmeseCajunCambodianCanadianCape VerdeanCarpatho RusynCelticCentral AmericanCentral American IndianCherokeeCheyenneChickasawChileanChineseChippewaChoctawColombianColvilleComancheCosta RicanCreeCreekCroatianCrowCubanCypriotCzechCzechoslovakianDanishDelawareDominicanDutchDutch West IndianEastern EuropeanEcuadorianEgyptianEnglishEstonianEthiopianEuropeanFijianFilipinoFinnishFrenchFrench American IndianFrench CanadianGermanGerman RussianGhanaianGreekGuamanian/ChamorroGuatemalanGuyaneseHaitianHmongHonduranHopiHoumaHungarianIcelanderIndian (Asian)IndonesianInupiatIranianIraqiIrishIroquoisIsraeliItalianJamaicanJapaneseJordanianKenyanKiowaKoreanLaotianLatvianLebaneseLiberianLithuanianLumbeeLuxembourgerMacedonianMalaysianMalteseMarshalleseMenomineeMexicanMexican American IndianMongolianMoroccanNative HawaiianNavajoNepaleseNew ZealanderNicaraguanNigerianNorthern EuropeanNorwegianOkinawanOsageOttawaPaiutePakistaniPalestinianPanamanianParaguayanPennsylvania GermanPeruvianPimaPolishPortuguesePotawatomiPuebloPuerto RicanPuget Sound SalishRomanianRussianSalvadoranSamoanScandinavianScotch-IrishScottishSeminoleSenegaleseSerbianShoshoneSierra LeoneanSiouxSlavicSlovakSloveneSomaliSouth AfricanSouth AmericanSouth American IndianSoviet UnionSpaniardSpanishSpanish AmericanSpanish American IndianSri LankanSubsaharan AfricanSudaneseSwedishSwissSyrianTaiwaneseThaiTlingit-HaidaTohono O'OdhamTonganTrinidadian and TobagonianTsimshianTurkishU.S. Virgin IslanderUgandanUkrainianUruguayanUteVenezuelanVietnameseWelshWest IndianYakamaYaquiYugoslavianYumanYup'ikZimbabwean
Immigration
NonimmigrantsImmigrantsAfghanistanAfricaAlbaniaArgentinaArmeniaAsiaAustraliaAustriaBahamasBangladeshBarbadosBelarusBelgiumBelizeBoliviaBosnia and HerzegovinaBrazilBulgariaBurma/MyanmarCabo VerdeCambodiaCameroonCanadaCaribbeanCentral AmericaChileChinaColombiaCongoCosta RicaCroatiaCubaCzechoslovakiaDenmarkDominicaDominican RepublicEastern AfricaEastern AsiaEastern EuropeEcuadorEgyptEl SalvadorEnglandEritreaEthiopiaEuropeFijiFranceGermanyGhanaGreeceGrenadaGuatemalaGuyanaHaitiHondurasHong KongHungaryIndiaIndonesiaIranIraqIrelandIsraelItalyJamaicaJapanJordanKazakhstanKenyaKoreaKuwaitLaosLatin AmericaLatviaLebanonLiberiaLithuaniaMalaysiaMexicoMicronesiaMiddle AfricaMoldovaMoroccoNepalNetherlandsNicaraguaNigeriaNorth AmericaNorth MacedoniaNorthern AfricaNorthern EuropeNorwayOceaniaPakistanPanamaPeruPhilippinesPolandPortugalRomaniaRussiaScotlandSenegalSerbiaSierra LeoneSingaporeSomaliaSouth AfricaSouth AmericaSouth Central AsiaSouth Eastern AsiaSouthern EuropeSpainSri LankaSt. Vincent and the GrenadinesSudanSwedenSwitzerlandSyriaTaiwanThailandTrinidad and TobagoTurkeyUgandaUkraineUruguayUzbekistanVenezuelaVietnamWest IndiesWestern AfricaWestern AsiaWestern EuropeYemenZaireZimbabweAzores
Immigrants from Saudi Arabia
Race
Ancestry
AfghanAfricanAlaska NativeAlaskan AthabascanAlbanianAleutAlsatianAmericanApacheArabArapahoArgentineanArmenianAssyrian/Chaldean/SyriacAustralianAustrianBahamianBangladeshiBarbadianBasqueBelgianBelizeanBermudanBhutaneseBlackfeetBolivianBrazilianBritishBritish West IndianBulgarianBurmeseCajunCambodianCanadianCape VerdeanCarpatho RusynCelticCentral AmericanCentral American IndianCherokeeCheyenneChickasawChileanChineseChippewaChoctawColombianColvilleComancheCosta RicanCreeCreekCroatianCrowCubanCypriotCzechCzechoslovakianDanishDelawareDominicanDutchDutch West IndianEastern EuropeanEcuadorianEgyptianEnglishEstonianEthiopianEuropeanFijianFilipinoFinnishFrenchFrench American IndianFrench CanadianGermanGerman RussianGhanaianGreekGuamanian/ChamorroGuatemalanGuyaneseHaitianHmongHonduranHopiHoumaHungarianIcelanderIndian (Asian)IndonesianInupiatIranianIraqiIrishIroquoisIsraeliItalianJamaicanJapaneseJordanianKenyanKiowaKoreanLaotianLatvianLebaneseLiberianLithuanianLumbeeLuxembourgerMacedonianMalaysianMalteseMarshalleseMenomineeMexicanMexican American IndianMongolianMoroccanNative HawaiianNavajoNepaleseNew ZealanderNicaraguanNigerianNorthern EuropeanNorwegianOkinawanOsageOttawaPaiutePakistaniPalestinianPanamanianParaguayanPennsylvania GermanPeruvianPimaPolishPortuguesePotawatomiPuebloPuerto RicanPuget Sound SalishRomanianRussianSalvadoranSamoanScandinavianScotch-IrishScottishSeminoleSenegaleseSerbianShoshoneSierra LeoneanSiouxSlavicSlovakSloveneSomaliSouth AfricanSouth AmericanSouth American IndianSoviet UnionSpaniardSpanishSpanish AmericanSpanish American IndianSri LankanSubsaharan AfricanSudaneseSwedishSwissTaiwaneseThaiTlingit-HaidaTohono O'OdhamTonganTrinidadian and TobagonianTsimshianTurkishU.S. Virgin IslanderUgandanUkrainianUruguayanUteVenezuelanVietnameseWelshWest IndianYakamaYaquiYugoslavianYumanYup'ikZimbabwean
Immigration
NonimmigrantsImmigrantsAfghanistanAfricaAlbaniaArgentinaArmeniaAsiaAustraliaAustriaBahamasBangladeshBarbadosBelarusBelgiumBelizeBoliviaBosnia and HerzegovinaBrazilBulgariaBurma/MyanmarCabo VerdeCambodiaCameroonCanadaCaribbeanCentral AmericaChileChinaColombiaCongoCosta RicaCroatiaCubaCzechoslovakiaDenmarkDominicaDominican RepublicEastern AfricaEastern AsiaEastern EuropeEcuadorEgyptEl SalvadorEnglandEritreaEthiopiaEuropeFijiFranceGermanyGhanaGreeceGrenadaGuatemalaGuyanaHaitiHondurasHong KongHungaryIndiaIndonesiaIranIraqIrelandIsraelItalyJamaicaJapanJordanKazakhstanKenyaKoreaKuwaitLaosLatin AmericaLatviaLebanonLiberiaLithuaniaMalaysiaMexicoMicronesiaMiddle AfricaMoldovaMoroccoNepalNetherlandsNicaraguaNigeriaNorth AmericaNorth MacedoniaNorthern AfricaNorthern EuropeNorwayOceaniaPakistanPanamaPeruPhilippinesPolandPortugalRomaniaRussiaSaudi ArabiaScotlandSenegalSerbiaSierra LeoneSingaporeSomaliaSouth AfricaSouth AmericaSouth Central AsiaSouth Eastern AsiaSouthern EuropeSpainSri LankaSt. Vincent and the GrenadinesSudanSwedenSwitzerlandSyriaTaiwanThailandTrinidad and TobagoTurkeyUgandaUkraineUruguayUzbekistanVenezuelaVietnamWest IndiesWestern AfricaWestern AsiaWestern EuropeYemenZaireZimbabweAzores
Female Poverty
Income
Poverty
Unemployment
Labor Participation
Family Structure
Vehicle Availability
Education Level
Disability

Female Poverty Comparison

Syrians

Immigrants from Saudi Arabia

Good
Tragic
13.0%
FEMALE POVERTY
79.6/ 100
METRIC RATING
145th/ 347
METRIC RANK
14.8%
FEMALE POVERTY
1.4/ 100
METRIC RATING
233rd/ 347
METRIC RANK

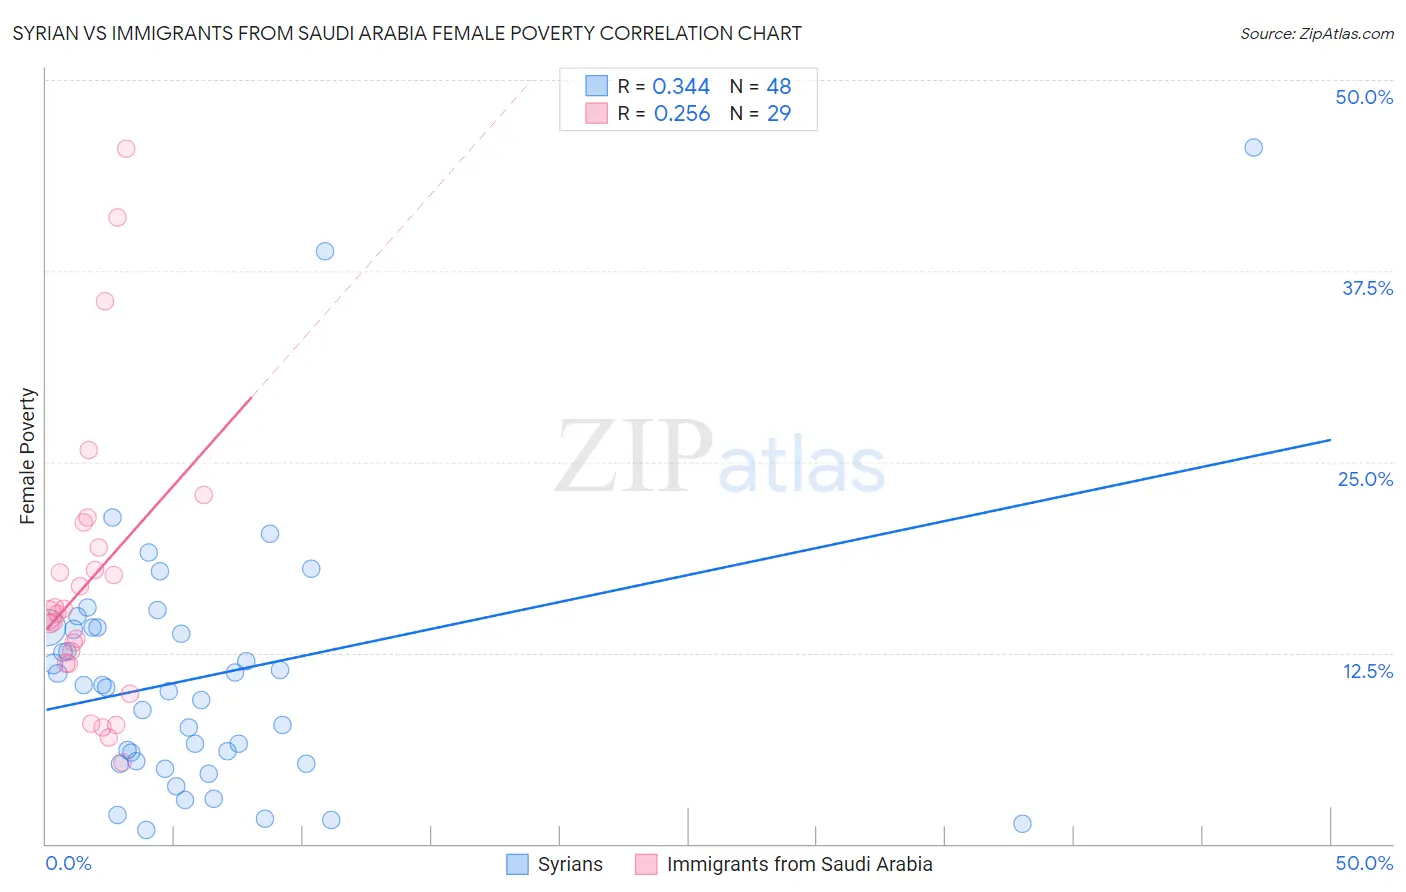
Syrian vs Immigrants from Saudi Arabia Female Poverty Correlation Chart

The statistical analysis conducted on geographies consisting of 266,159,377 people shows a mild positive correlation between the proportion of Syrians and poverty level among females in the United States with a correlation coefficient (R) of 0.344 and weighted average of 13.0%. Similarly, the statistical analysis conducted on geographies consisting of 164,202,367 people shows a weak positive correlation between the proportion of Immigrants from Saudi Arabia and poverty level among females in the United States with a correlation coefficient (R) of 0.256 and weighted average of 14.8%, a difference of 14.0%.
Syrian vs Immigrants from Saudi Arabia Female Poverty

Female Poverty Correlation Summary

MeasurementSyrianImmigrants from Saudi Arabia
Minimum0.87%5.3%
Maximum45.6%45.5%
Range44.7%40.2%
Mean11.0%17.3%
Median10.3%15.1%
Interquartile 25% (IQ1)5.3%11.8%
Interquartile 75% (IQ3)14.1%20.2%
Interquartile Range (IQR)8.8%8.4%
Standard Deviation (Sample)8.5%9.6%
Standard Deviation (Population)8.4%9.4%

Similar Demographics by Female Poverty

Demographics Similar to Syrians by Female Poverty

In terms of female poverty, the demographic groups most similar to Syrians are Afghan (13.0%, a difference of 0.030%), Immigrants from Peru (13.0%, a difference of 0.080%), Immigrants from Malaysia (13.0%, a difference of 0.12%), Brazilian (13.0%, a difference of 0.14%), and Immigrants from Kazakhstan (13.0%, a difference of 0.16%).
DemographicsRating | RankFemale Poverty
Immigrants | France
83.6
/100
|
#138
Excellent
12.9%
Basques
83.1
/100
|
#139
Excellent
12.9%
Pakistanis
83.0
/100
|
#140
Excellent
12.9%
Icelanders
81.1
/100
|
#141
Excellent
13.0%
Brazilians
80.5
/100
|
#142
Excellent
13.0%
Immigrants | Malaysia
80.4
/100
|
#143
Excellent
13.0%
Afghans
79.8
/100
|
#144
Good
13.0%
Syrians
79.6
/100
|
#145
Good
13.0%
Immigrants | Peru
79.1
/100
|
#146
Good
13.0%
Immigrants | Kazakhstan
78.6
/100
|
#147
Good
13.0%
Yugoslavians
76.9
/100
|
#148
Good
13.1%
Taiwanese
75.7
/100
|
#149
Good
13.1%
Tsimshian
75.5
/100
|
#150
Good
13.1%
Immigrants | Germany
74.9
/100
|
#151
Good
13.1%
Samoans
73.6
/100
|
#152
Good
13.1%

Demographics Similar to Immigrants from Saudi Arabia by Female Poverty

In terms of female poverty, the demographic groups most similar to Immigrants from Saudi Arabia are Osage (14.8%, a difference of 0.10%), Nigerian (14.8%, a difference of 0.41%), Alaska Native (14.7%, a difference of 0.51%), Fijian (14.9%, a difference of 0.52%), and Ghanaian (14.7%, a difference of 0.71%).
DemographicsRating | RankFemale Poverty
Immigrants | Eritrea
2.4
/100
|
#226
Tragic
14.6%
Immigrants | Nigeria
2.1
/100
|
#227
Tragic
14.7%
German Russians
2.0
/100
|
#228
Tragic
14.7%
Ghanaians
1.9
/100
|
#229
Tragic
14.7%
Alaska Natives
1.8
/100
|
#230
Tragic
14.7%
Nigerians
1.7
/100
|
#231
Tragic
14.8%
Osage
1.5
/100
|
#232
Tragic
14.8%
Immigrants | Saudi Arabia
1.4
/100
|
#233
Tragic
14.8%
Fijians
1.1
/100
|
#234
Tragic
14.9%
Immigrants | Laos
0.9
/100
|
#235
Tragic
15.0%
Cree
0.7
/100
|
#236
Tragic
15.1%
French American Indians
0.6
/100
|
#237
Tragic
15.1%
Immigrants | Armenia
0.6
/100
|
#238
Tragic
15.1%
Immigrants | Middle Africa
0.5
/100
|
#239
Tragic
15.2%
Sudanese
0.5
/100
|
#240
Tragic
15.2%