Sudanese vs Jamaican Single Father Poverty
COMPARE
Sudanese
Jamaican
Single Father Poverty
Single Father Poverty Comparison
Sudanese
Jamaicans
15.9%
SINGLE FATHER POVERTY
91.6/ 100
METRIC RATING
122nd/ 347
METRIC RANK
17.3%
SINGLE FATHER POVERTY
0.3/ 100
METRIC RATING
266th/ 347
METRIC RANK
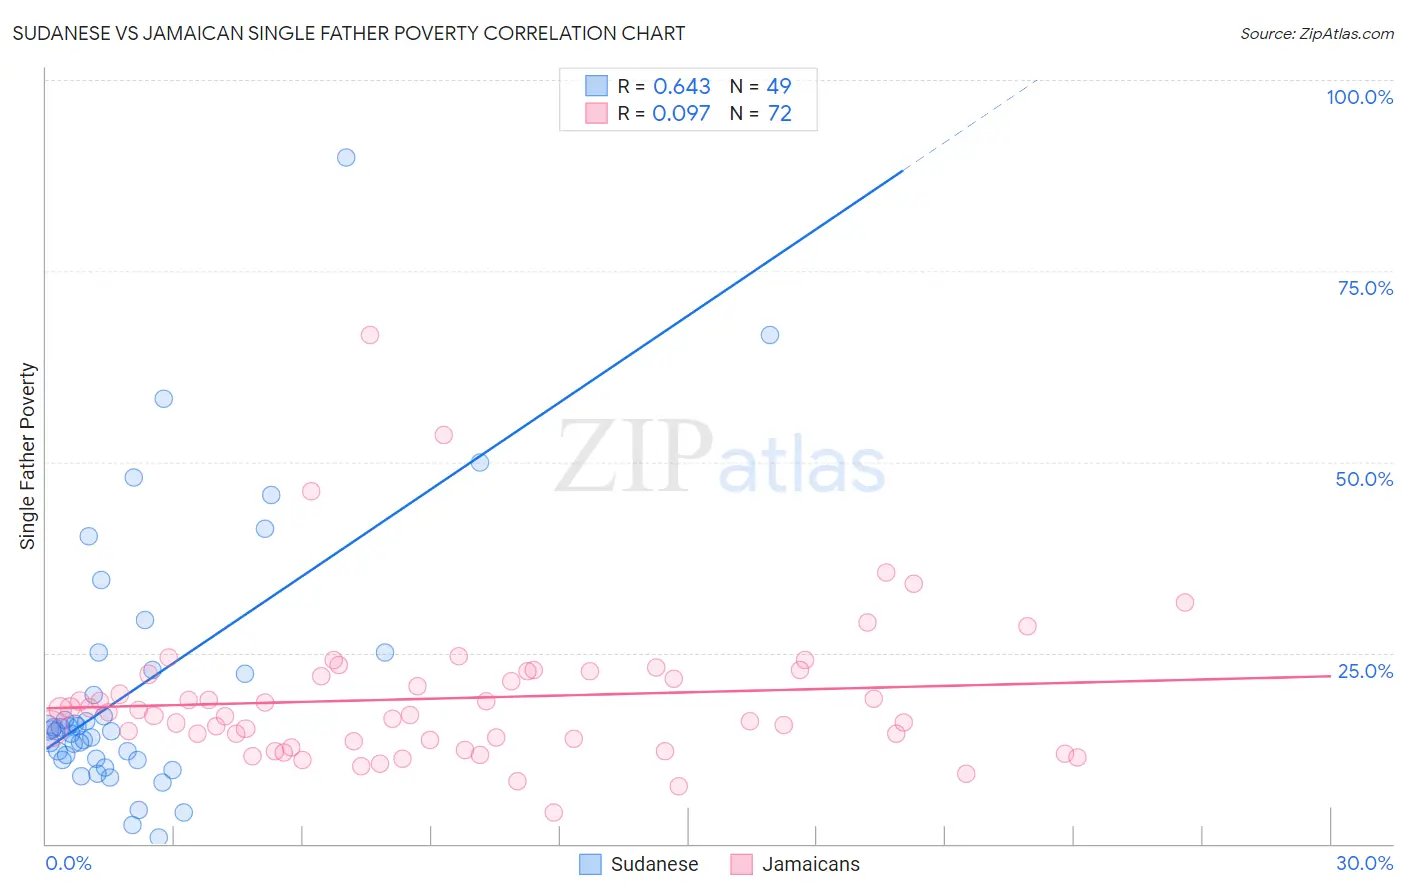
Sudanese vs Jamaican Single Father Poverty Correlation Chart
The statistical analysis conducted on geographies consisting of 100,935,814 people shows a significant positive correlation between the proportion of Sudanese and poverty level among single fathers in the United States with a correlation coefficient (R) of 0.643 and weighted average of 15.9%. Similarly, the statistical analysis conducted on geographies consisting of 295,636,374 people shows a slight positive correlation between the proportion of Jamaicans and poverty level among single fathers in the United States with a correlation coefficient (R) of 0.097 and weighted average of 17.3%, a difference of 9.2%.
Single Father Poverty Correlation Summary
| Measurement | Sudanese | Jamaican |
| Minimum | 0.76% | 4.1% |
| Maximum | 89.9% | 66.7% |
| Range | 89.1% | 62.6% |
| Mean | 20.8% | 19.1% |
| Median | 14.9% | 17.1% |
| Interquartile 25% (IQ1) | 11.0% | 13.5% |
| Interquartile 75% (IQ3) | 23.9% | 22.4% |
| Interquartile Range (IQR) | 12.9% | 8.8% |
| Standard Deviation (Sample) | 17.6% | 9.8% |
| Standard Deviation (Population) | 17.4% | 9.8% |
Similar Demographics by Single Father Poverty
Demographics Similar to Sudanese by Single Father Poverty
In terms of single father poverty, the demographic groups most similar to Sudanese are Palestinian (15.9%, a difference of 0.040%), Immigrants from Panama (15.9%, a difference of 0.040%), Iraqi (15.9%, a difference of 0.050%), Immigrants (15.9%, a difference of 0.060%), and Hmong (15.9%, a difference of 0.070%).
| Demographics | Rating | Rank | Single Father Poverty |
| Immigrants | Thailand | 93.6 /100 | #115 | Exceptional 15.8% |
| Immigrants | Argentina | 92.8 /100 | #116 | Exceptional 15.8% |
| Immigrants | Colombia | 92.6 /100 | #117 | Exceptional 15.8% |
| Immigrants | Eastern Europe | 92.5 /100 | #118 | Exceptional 15.8% |
| Immigrants | Belarus | 92.4 /100 | #119 | Exceptional 15.8% |
| Uruguayans | 92.1 /100 | #120 | Exceptional 15.9% |
| Immigrants | Immigrants | 91.9 /100 | #121 | Exceptional 15.9% |
| Sudanese | 91.6 /100 | #122 | Exceptional 15.9% |
| Palestinians | 91.3 /100 | #123 | Exceptional 15.9% |
| Immigrants | Panama | 91.3 /100 | #124 | Exceptional 15.9% |
| Iraqis | 91.2 /100 | #125 | Exceptional 15.9% |
| Hmong | 91.1 /100 | #126 | Exceptional 15.9% |
| Immigrants | Liberia | 91.1 /100 | #127 | Exceptional 15.9% |
| Immigrants | Nigeria | 90.8 /100 | #128 | Exceptional 15.9% |
| Immigrants | West Indies | 90.8 /100 | #129 | Exceptional 15.9% |
Demographics Similar to Jamaicans by Single Father Poverty
In terms of single father poverty, the demographic groups most similar to Jamaicans are Haitian (17.3%, a difference of 0.040%), Slovene (17.3%, a difference of 0.060%), Polish (17.3%, a difference of 0.060%), Immigrants from Caribbean (17.4%, a difference of 0.14%), and Slavic (17.4%, a difference of 0.21%).
| Demographics | Rating | Rank | Single Father Poverty |
| Immigrants | Jamaica | 0.7 /100 | #259 | Tragic 17.2% |
| Spaniards | 0.6 /100 | #260 | Tragic 17.2% |
| Swiss | 0.5 /100 | #261 | Tragic 17.3% |
| Immigrants | Zaire | 0.4 /100 | #262 | Tragic 17.3% |
| Lithuanians | 0.4 /100 | #263 | Tragic 17.3% |
| Slovenes | 0.3 /100 | #264 | Tragic 17.3% |
| Poles | 0.3 /100 | #265 | Tragic 17.3% |
| Jamaicans | 0.3 /100 | #266 | Tragic 17.3% |
| Haitians | 0.3 /100 | #267 | Tragic 17.3% |
| Immigrants | Caribbean | 0.3 /100 | #268 | Tragic 17.4% |
| Slavs | 0.3 /100 | #269 | Tragic 17.4% |
| Indonesians | 0.2 /100 | #270 | Tragic 17.4% |
| French American Indians | 0.2 /100 | #271 | Tragic 17.4% |
| Barbadians | 0.1 /100 | #272 | Tragic 17.5% |
| Italians | 0.1 /100 | #273 | Tragic 17.5% |