Sudanese vs Costa Rican Single Father Poverty
COMPARE
Sudanese
Costa Rican
Single Father Poverty
Single Father Poverty Comparison
Sudanese
Costa Ricans
15.9%
SINGLE FATHER POVERTY
91.6/ 100
METRIC RATING
122nd/ 347
METRIC RANK
16.3%
SINGLE FATHER POVERTY
53.6/ 100
METRIC RATING
168th/ 347
METRIC RANK
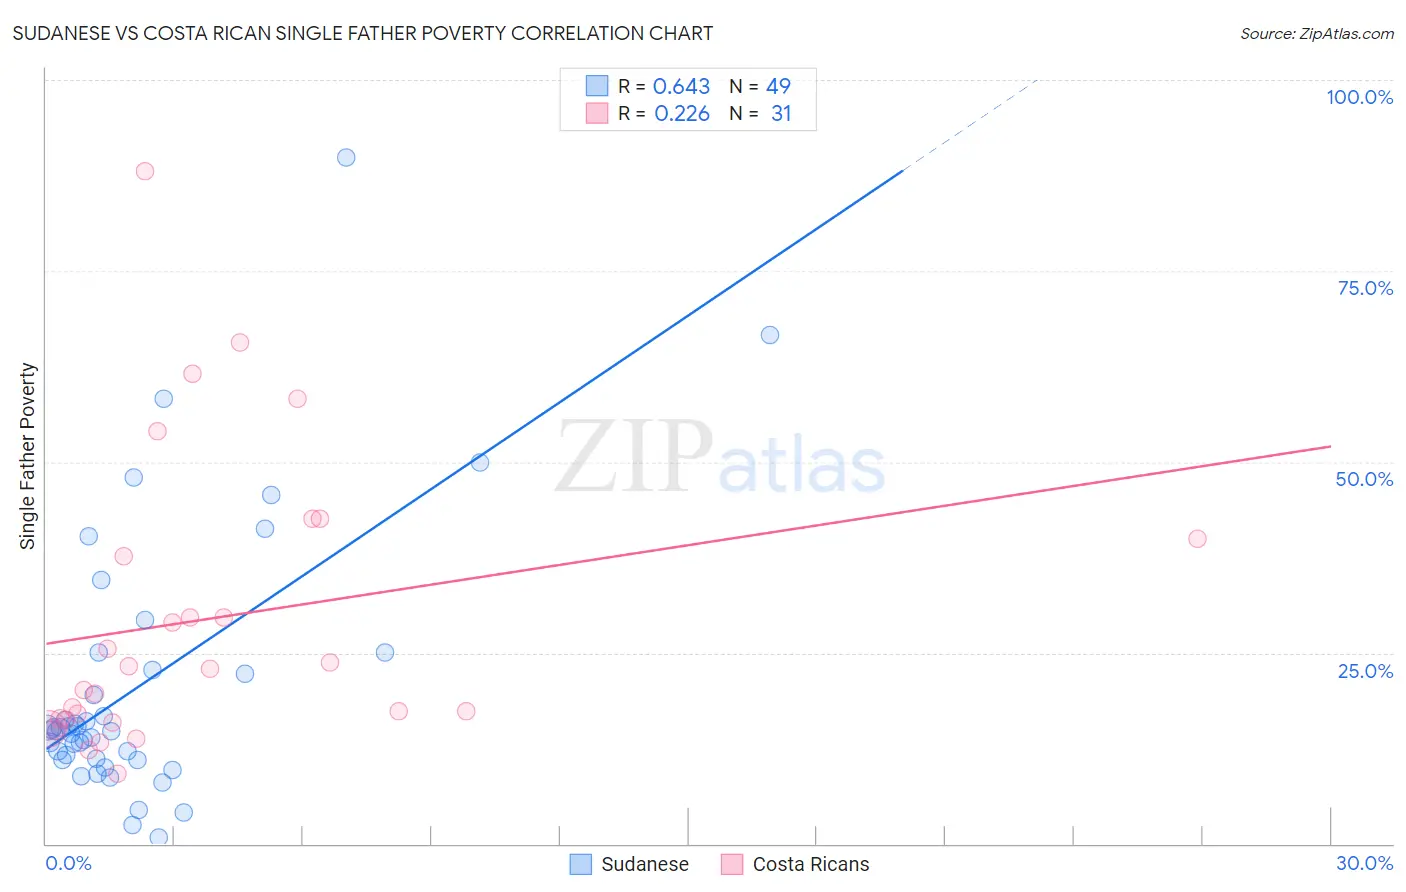
Sudanese vs Costa Rican Single Father Poverty Correlation Chart
The statistical analysis conducted on geographies consisting of 100,935,814 people shows a significant positive correlation between the proportion of Sudanese and poverty level among single fathers in the United States with a correlation coefficient (R) of 0.643 and weighted average of 15.9%. Similarly, the statistical analysis conducted on geographies consisting of 214,282,410 people shows a weak positive correlation between the proportion of Costa Ricans and poverty level among single fathers in the United States with a correlation coefficient (R) of 0.226 and weighted average of 16.3%, a difference of 2.5%.
Single Father Poverty Correlation Summary
| Measurement | Sudanese | Costa Rican |
| Minimum | 0.76% | 9.2% |
| Maximum | 89.9% | 88.0% |
| Range | 89.1% | 78.8% |
| Mean | 20.8% | 29.4% |
| Median | 14.9% | 23.0% |
| Interquartile 25% (IQ1) | 11.0% | 16.2% |
| Interquartile 75% (IQ3) | 23.9% | 40.0% |
| Interquartile Range (IQR) | 12.9% | 23.8% |
| Standard Deviation (Sample) | 17.6% | 18.9% |
| Standard Deviation (Population) | 17.4% | 18.6% |
Similar Demographics by Single Father Poverty
Demographics Similar to Sudanese by Single Father Poverty
In terms of single father poverty, the demographic groups most similar to Sudanese are Palestinian (15.9%, a difference of 0.040%), Immigrants from Panama (15.9%, a difference of 0.040%), Iraqi (15.9%, a difference of 0.050%), Immigrants (15.9%, a difference of 0.060%), and Hmong (15.9%, a difference of 0.070%).
| Demographics | Rating | Rank | Single Father Poverty |
| Immigrants | Thailand | 93.6 /100 | #115 | Exceptional 15.8% |
| Immigrants | Argentina | 92.8 /100 | #116 | Exceptional 15.8% |
| Immigrants | Colombia | 92.6 /100 | #117 | Exceptional 15.8% |
| Immigrants | Eastern Europe | 92.5 /100 | #118 | Exceptional 15.8% |
| Immigrants | Belarus | 92.4 /100 | #119 | Exceptional 15.8% |
| Uruguayans | 92.1 /100 | #120 | Exceptional 15.9% |
| Immigrants | Immigrants | 91.9 /100 | #121 | Exceptional 15.9% |
| Sudanese | 91.6 /100 | #122 | Exceptional 15.9% |
| Palestinians | 91.3 /100 | #123 | Exceptional 15.9% |
| Immigrants | Panama | 91.3 /100 | #124 | Exceptional 15.9% |
| Iraqis | 91.2 /100 | #125 | Exceptional 15.9% |
| Hmong | 91.1 /100 | #126 | Exceptional 15.9% |
| Immigrants | Liberia | 91.1 /100 | #127 | Exceptional 15.9% |
| Immigrants | Nigeria | 90.8 /100 | #128 | Exceptional 15.9% |
| Immigrants | West Indies | 90.8 /100 | #129 | Exceptional 15.9% |
Demographics Similar to Costa Ricans by Single Father Poverty
In terms of single father poverty, the demographic groups most similar to Costa Ricans are Yugoslavian (16.3%, a difference of 0.010%), Northern European (16.3%, a difference of 0.040%), Immigrants from Europe (16.3%, a difference of 0.050%), Scandinavian (16.3%, a difference of 0.060%), and Guyanese (16.3%, a difference of 0.070%).
| Demographics | Rating | Rank | Single Father Poverty |
| Estonians | 56.7 /100 | #161 | Average 16.2% |
| Ugandans | 55.9 /100 | #162 | Average 16.3% |
| Immigrants | Costa Rica | 55.7 /100 | #163 | Average 16.3% |
| Guyanese | 55.2 /100 | #164 | Average 16.3% |
| Immigrants | Bangladesh | 55.1 /100 | #165 | Average 16.3% |
| Immigrants | Europe | 54.8 /100 | #166 | Average 16.3% |
| Yugoslavians | 53.9 /100 | #167 | Average 16.3% |
| Costa Ricans | 53.6 /100 | #168 | Average 16.3% |
| Northern Europeans | 52.8 /100 | #169 | Average 16.3% |
| Scandinavians | 52.3 /100 | #170 | Average 16.3% |
| Immigrants | Morocco | 50.7 /100 | #171 | Average 16.3% |
| Immigrants | Sierra Leone | 50.1 /100 | #172 | Average 16.3% |
| Immigrants | St. Vincent and the Grenadines | 50.0 /100 | #173 | Average 16.3% |
| Swedes | 50.0 /100 | #174 | Average 16.3% |
| Immigrants | Ecuador | 49.7 /100 | #175 | Average 16.3% |