Sudanese vs Immigrants from Bahamas Single Father Poverty
COMPARE
Sudanese
Immigrants from Bahamas
Single Father Poverty
Single Father Poverty Comparison
Sudanese
Immigrants from Bahamas
15.9%
SINGLE FATHER POVERTY
91.6/ 100
METRIC RATING
122nd/ 347
METRIC RANK
18.1%
SINGLE FATHER POVERTY
0.0/ 100
METRIC RATING
292nd/ 347
METRIC RANK
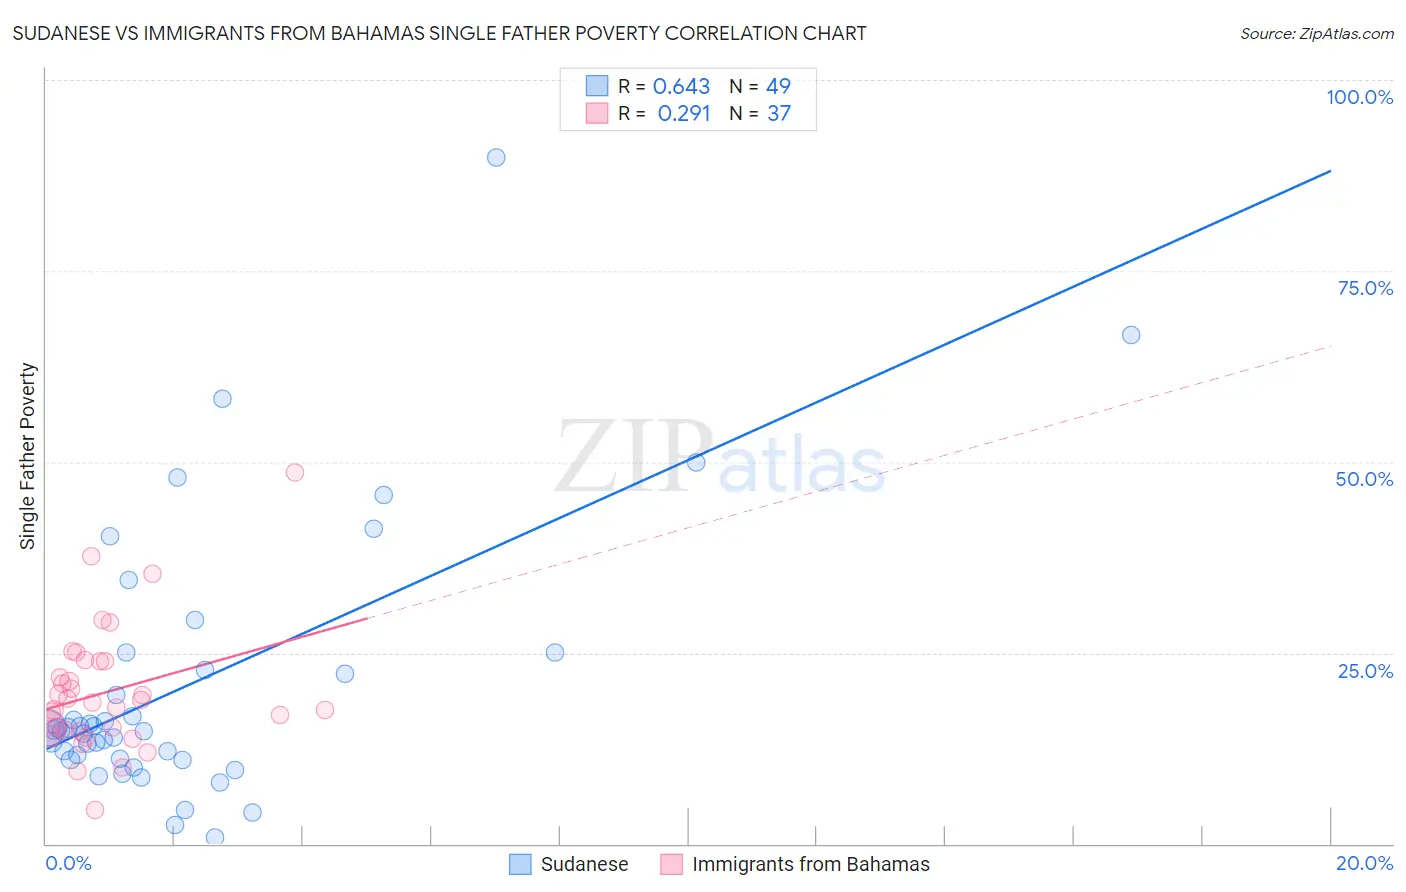
Sudanese vs Immigrants from Bahamas Single Father Poverty Correlation Chart
The statistical analysis conducted on geographies consisting of 100,935,814 people shows a significant positive correlation between the proportion of Sudanese and poverty level among single fathers in the United States with a correlation coefficient (R) of 0.643 and weighted average of 15.9%. Similarly, the statistical analysis conducted on geographies consisting of 96,162,173 people shows a weak positive correlation between the proportion of Immigrants from Bahamas and poverty level among single fathers in the United States with a correlation coefficient (R) of 0.291 and weighted average of 18.1%, a difference of 14.0%.
Single Father Poverty Correlation Summary
| Measurement | Sudanese | Immigrants from Bahamas |
| Minimum | 0.76% | 4.5% |
| Maximum | 89.9% | 48.6% |
| Range | 89.1% | 44.1% |
| Mean | 20.8% | 19.9% |
| Median | 14.9% | 18.6% |
| Interquartile 25% (IQ1) | 11.0% | 14.8% |
| Interquartile 75% (IQ3) | 23.9% | 23.9% |
| Interquartile Range (IQR) | 12.9% | 9.1% |
| Standard Deviation (Sample) | 17.6% | 8.3% |
| Standard Deviation (Population) | 17.4% | 8.2% |
Similar Demographics by Single Father Poverty
Demographics Similar to Sudanese by Single Father Poverty
In terms of single father poverty, the demographic groups most similar to Sudanese are Palestinian (15.9%, a difference of 0.040%), Immigrants from Panama (15.9%, a difference of 0.040%), Iraqi (15.9%, a difference of 0.050%), Immigrants (15.9%, a difference of 0.060%), and Hmong (15.9%, a difference of 0.070%).
| Demographics | Rating | Rank | Single Father Poverty |
| Immigrants | Thailand | 93.6 /100 | #115 | Exceptional 15.8% |
| Immigrants | Argentina | 92.8 /100 | #116 | Exceptional 15.8% |
| Immigrants | Colombia | 92.6 /100 | #117 | Exceptional 15.8% |
| Immigrants | Eastern Europe | 92.5 /100 | #118 | Exceptional 15.8% |
| Immigrants | Belarus | 92.4 /100 | #119 | Exceptional 15.8% |
| Uruguayans | 92.1 /100 | #120 | Exceptional 15.9% |
| Immigrants | Immigrants | 91.9 /100 | #121 | Exceptional 15.9% |
| Sudanese | 91.6 /100 | #122 | Exceptional 15.9% |
| Palestinians | 91.3 /100 | #123 | Exceptional 15.9% |
| Immigrants | Panama | 91.3 /100 | #124 | Exceptional 15.9% |
| Iraqis | 91.2 /100 | #125 | Exceptional 15.9% |
| Hmong | 91.1 /100 | #126 | Exceptional 15.9% |
| Immigrants | Liberia | 91.1 /100 | #127 | Exceptional 15.9% |
| Immigrants | Nigeria | 90.8 /100 | #128 | Exceptional 15.9% |
| Immigrants | West Indies | 90.8 /100 | #129 | Exceptional 15.9% |
Demographics Similar to Immigrants from Bahamas by Single Father Poverty
In terms of single father poverty, the demographic groups most similar to Immigrants from Bahamas are Alaskan Athabascan (18.1%, a difference of 0.010%), Alaska Native (18.1%, a difference of 0.11%), U.S. Virgin Islander (18.1%, a difference of 0.13%), Yakama (18.1%, a difference of 0.20%), and West Indian (18.0%, a difference of 0.23%).
| Demographics | Rating | Rank | Single Father Poverty |
| Immigrants | Lebanon | 0.0 /100 | #285 | Tragic 17.9% |
| Immigrants | North Macedonia | 0.0 /100 | #286 | Tragic 17.9% |
| Carpatho Rusyns | 0.0 /100 | #287 | Tragic 18.0% |
| Bahamians | 0.0 /100 | #288 | Tragic 18.0% |
| Irish | 0.0 /100 | #289 | Tragic 18.0% |
| West Indians | 0.0 /100 | #290 | Tragic 18.0% |
| Alaskan Athabascans | 0.0 /100 | #291 | Tragic 18.1% |
| Immigrants | Bahamas | 0.0 /100 | #292 | Tragic 18.1% |
| Alaska Natives | 0.0 /100 | #293 | Tragic 18.1% |
| U.S. Virgin Islanders | 0.0 /100 | #294 | Tragic 18.1% |
| Yakama | 0.0 /100 | #295 | Tragic 18.1% |
| Seminole | 0.0 /100 | #296 | Tragic 18.1% |
| French | 0.0 /100 | #297 | Tragic 18.2% |
| Africans | 0.0 /100 | #298 | Tragic 18.3% |
| Whites/Caucasians | 0.0 /100 | #299 | Tragic 18.4% |