Sudanese vs Immigrants from Middle Africa Single Father Poverty
COMPARE
Sudanese
Immigrants from Middle Africa
Single Father Poverty
Single Father Poverty Comparison
Sudanese
Immigrants from Middle Africa
15.9%
SINGLE FATHER POVERTY
91.6/ 100
METRIC RATING
122nd/ 347
METRIC RANK
15.6%
SINGLE FATHER POVERTY
97.4/ 100
METRIC RATING
99th/ 347
METRIC RANK
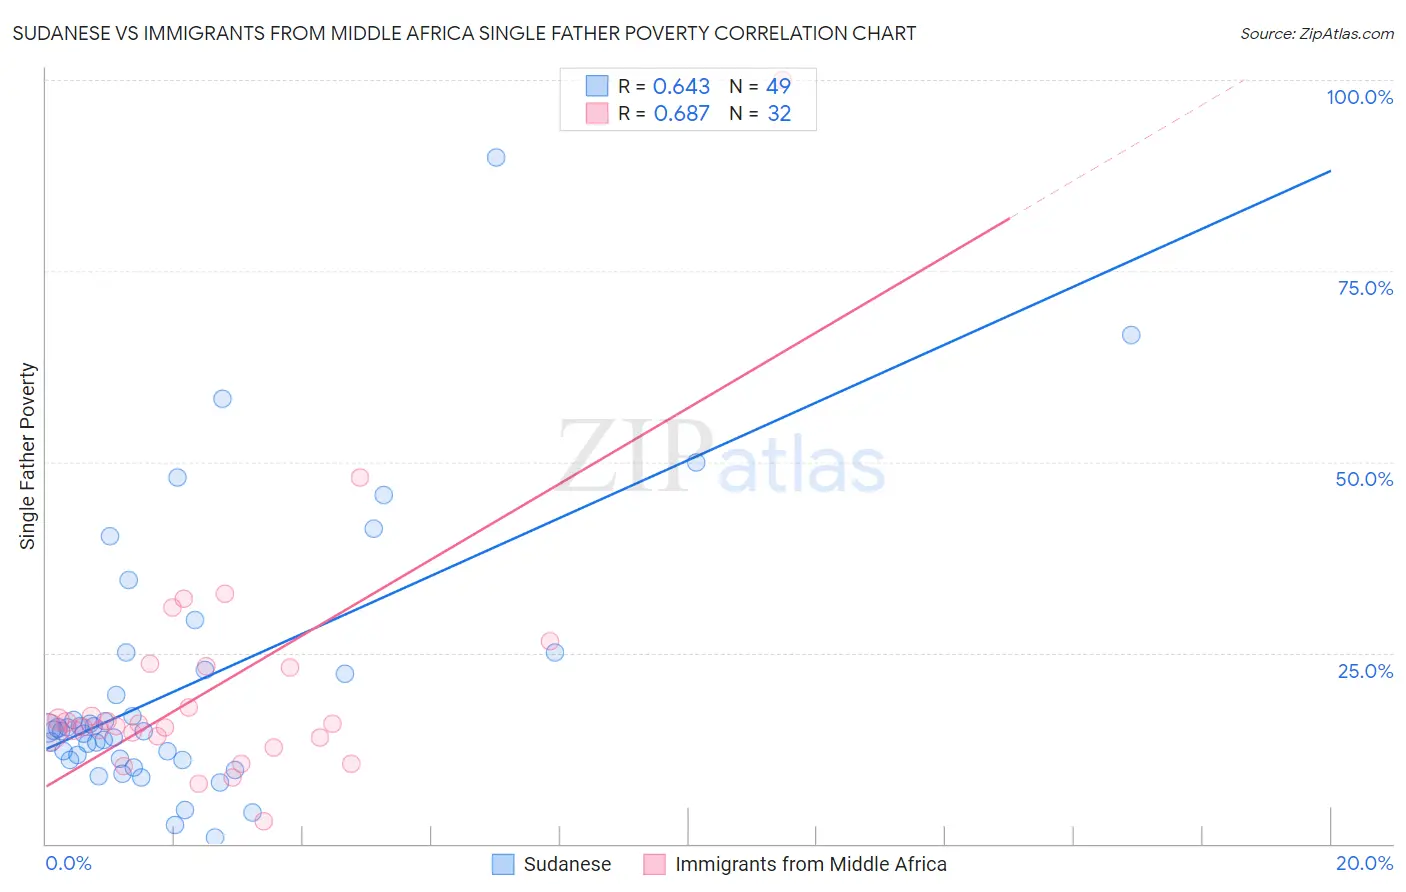
Sudanese vs Immigrants from Middle Africa Single Father Poverty Correlation Chart
The statistical analysis conducted on geographies consisting of 100,935,814 people shows a significant positive correlation between the proportion of Sudanese and poverty level among single fathers in the United States with a correlation coefficient (R) of 0.643 and weighted average of 15.9%. Similarly, the statistical analysis conducted on geographies consisting of 176,911,410 people shows a significant positive correlation between the proportion of Immigrants from Middle Africa and poverty level among single fathers in the United States with a correlation coefficient (R) of 0.687 and weighted average of 15.6%, a difference of 1.4%.
Single Father Poverty Correlation Summary
| Measurement | Sudanese | Immigrants from Middle Africa |
| Minimum | 0.76% | 3.0% |
| Maximum | 89.9% | 100.0% |
| Range | 89.1% | 97.0% |
| Mean | 20.8% | 20.3% |
| Median | 14.9% | 15.6% |
| Interquartile 25% (IQ1) | 11.0% | 14.0% |
| Interquartile 75% (IQ3) | 23.9% | 23.2% |
| Interquartile Range (IQR) | 12.9% | 9.2% |
| Standard Deviation (Sample) | 17.6% | 17.0% |
| Standard Deviation (Population) | 17.4% | 16.7% |
Similar Demographics by Single Father Poverty
Demographics Similar to Sudanese by Single Father Poverty
In terms of single father poverty, the demographic groups most similar to Sudanese are Palestinian (15.9%, a difference of 0.040%), Immigrants from Panama (15.9%, a difference of 0.040%), Iraqi (15.9%, a difference of 0.050%), Immigrants (15.9%, a difference of 0.060%), and Hmong (15.9%, a difference of 0.070%).
| Demographics | Rating | Rank | Single Father Poverty |
| Immigrants | Thailand | 93.6 /100 | #115 | Exceptional 15.8% |
| Immigrants | Argentina | 92.8 /100 | #116 | Exceptional 15.8% |
| Immigrants | Colombia | 92.6 /100 | #117 | Exceptional 15.8% |
| Immigrants | Eastern Europe | 92.5 /100 | #118 | Exceptional 15.8% |
| Immigrants | Belarus | 92.4 /100 | #119 | Exceptional 15.8% |
| Uruguayans | 92.1 /100 | #120 | Exceptional 15.9% |
| Immigrants | Immigrants | 91.9 /100 | #121 | Exceptional 15.9% |
| Sudanese | 91.6 /100 | #122 | Exceptional 15.9% |
| Palestinians | 91.3 /100 | #123 | Exceptional 15.9% |
| Immigrants | Panama | 91.3 /100 | #124 | Exceptional 15.9% |
| Iraqis | 91.2 /100 | #125 | Exceptional 15.9% |
| Hmong | 91.1 /100 | #126 | Exceptional 15.9% |
| Immigrants | Liberia | 91.1 /100 | #127 | Exceptional 15.9% |
| Immigrants | Nigeria | 90.8 /100 | #128 | Exceptional 15.9% |
| Immigrants | West Indies | 90.8 /100 | #129 | Exceptional 15.9% |
Demographics Similar to Immigrants from Middle Africa by Single Father Poverty
In terms of single father poverty, the demographic groups most similar to Immigrants from Middle Africa are Immigrants from Chile (15.7%, a difference of 0.22%), Fijian (15.7%, a difference of 0.25%), Zimbabwean (15.6%, a difference of 0.36%), Yaqui (15.6%, a difference of 0.37%), and Immigrants from Belgium (15.6%, a difference of 0.38%).
| Demographics | Rating | Rank | Single Father Poverty |
| Immigrants | Serbia | 98.5 /100 | #92 | Exceptional 15.5% |
| Basques | 98.4 /100 | #93 | Exceptional 15.5% |
| Immigrants | Uruguay | 98.2 /100 | #94 | Exceptional 15.6% |
| Immigrants | Kazakhstan | 98.2 /100 | #95 | Exceptional 15.6% |
| Immigrants | Belgium | 98.1 /100 | #96 | Exceptional 15.6% |
| Yaqui | 98.1 /100 | #97 | Exceptional 15.6% |
| Zimbabweans | 98.1 /100 | #98 | Exceptional 15.6% |
| Immigrants | Middle Africa | 97.4 /100 | #99 | Exceptional 15.6% |
| Immigrants | Chile | 96.9 /100 | #100 | Exceptional 15.7% |
| Fijians | 96.8 /100 | #101 | Exceptional 15.7% |
| Chileans | 96.4 /100 | #102 | Exceptional 15.7% |
| South American Indians | 96.2 /100 | #103 | Exceptional 15.7% |
| Australians | 96.1 /100 | #104 | Exceptional 15.7% |
| Immigrants | Australia | 96.1 /100 | #105 | Exceptional 15.7% |
| Immigrants | Poland | 95.8 /100 | #106 | Exceptional 15.7% |