Immigrants from South Central Asia vs Jamaican Single Father Poverty
COMPARE
Immigrants from South Central Asia
Jamaican
Single Father Poverty
Single Father Poverty Comparison
Immigrants from South Central Asia
Jamaicans
14.5%
SINGLE FATHER POVERTY
100.0/ 100
METRIC RATING
28th/ 347
METRIC RANK
17.3%
SINGLE FATHER POVERTY
0.3/ 100
METRIC RATING
266th/ 347
METRIC RANK
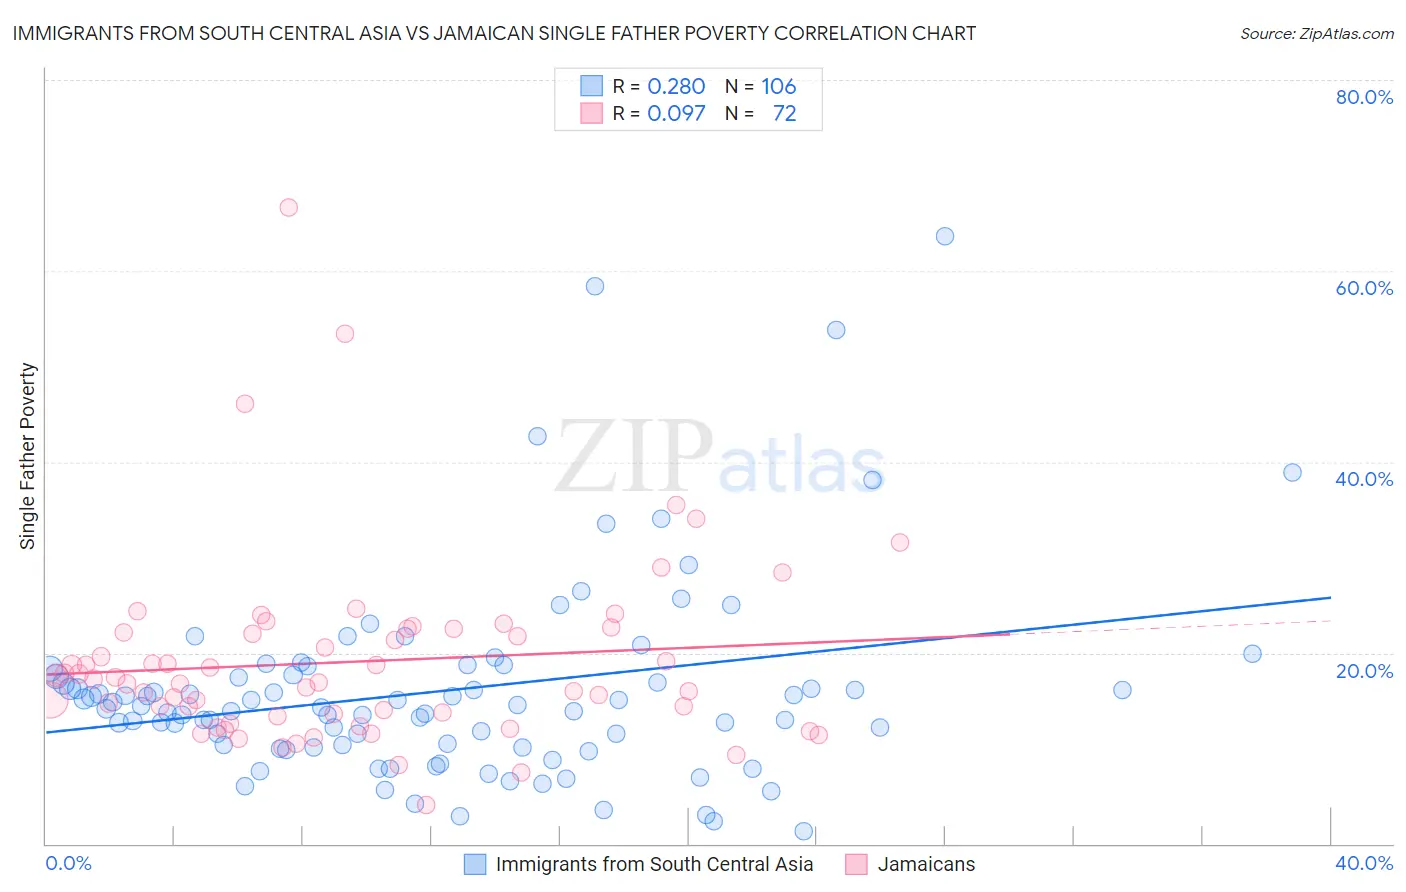
Immigrants from South Central Asia vs Jamaican Single Father Poverty Correlation Chart
The statistical analysis conducted on geographies consisting of 359,481,520 people shows a weak positive correlation between the proportion of Immigrants from South Central Asia and poverty level among single fathers in the United States with a correlation coefficient (R) of 0.280 and weighted average of 14.5%. Similarly, the statistical analysis conducted on geographies consisting of 295,636,374 people shows a slight positive correlation between the proportion of Jamaicans and poverty level among single fathers in the United States with a correlation coefficient (R) of 0.097 and weighted average of 17.3%, a difference of 19.5%.
Single Father Poverty Correlation Summary
| Measurement | Immigrants from South Central Asia | Jamaican |
| Minimum | 1.4% | 4.1% |
| Maximum | 63.6% | 66.7% |
| Range | 62.3% | 62.6% |
| Mean | 16.0% | 19.1% |
| Median | 14.3% | 17.1% |
| Interquartile 25% (IQ1) | 10.4% | 13.5% |
| Interquartile 75% (IQ3) | 17.7% | 22.4% |
| Interquartile Range (IQR) | 7.3% | 8.8% |
| Standard Deviation (Sample) | 10.4% | 9.8% |
| Standard Deviation (Population) | 10.4% | 9.8% |
Similar Demographics by Single Father Poverty
Demographics Similar to Immigrants from South Central Asia by Single Father Poverty
In terms of single father poverty, the demographic groups most similar to Immigrants from South Central Asia are Somali (14.5%, a difference of 0.11%), Thai (14.5%, a difference of 0.15%), Icelander (14.5%, a difference of 0.23%), Asian (14.6%, a difference of 0.38%), and Nepalese (14.4%, a difference of 0.53%).
| Demographics | Rating | Rank | Single Father Poverty |
| Immigrants | Afghanistan | 100.0 /100 | #21 | Exceptional 14.3% |
| Taiwanese | 100.0 /100 | #22 | Exceptional 14.3% |
| Immigrants | Egypt | 100.0 /100 | #23 | Exceptional 14.4% |
| Immigrants | South Eastern Asia | 100.0 /100 | #24 | Exceptional 14.4% |
| Iranians | 100.0 /100 | #25 | Exceptional 14.4% |
| Spanish American Indians | 100.0 /100 | #26 | Exceptional 14.4% |
| Nepalese | 100.0 /100 | #27 | Exceptional 14.4% |
| Immigrants | South Central Asia | 100.0 /100 | #28 | Exceptional 14.5% |
| Somalis | 100.0 /100 | #29 | Exceptional 14.5% |
| Thais | 100.0 /100 | #30 | Exceptional 14.5% |
| Icelanders | 100.0 /100 | #31 | Exceptional 14.5% |
| Asians | 100.0 /100 | #32 | Exceptional 14.6% |
| Okinawans | 100.0 /100 | #33 | Exceptional 14.6% |
| Egyptians | 100.0 /100 | #34 | Exceptional 14.7% |
| Immigrants | Bolivia | 100.0 /100 | #35 | Exceptional 14.7% |
Demographics Similar to Jamaicans by Single Father Poverty
In terms of single father poverty, the demographic groups most similar to Jamaicans are Haitian (17.3%, a difference of 0.040%), Slovene (17.3%, a difference of 0.060%), Polish (17.3%, a difference of 0.060%), Immigrants from Caribbean (17.4%, a difference of 0.14%), and Slavic (17.4%, a difference of 0.21%).
| Demographics | Rating | Rank | Single Father Poverty |
| Immigrants | Jamaica | 0.7 /100 | #259 | Tragic 17.2% |
| Spaniards | 0.6 /100 | #260 | Tragic 17.2% |
| Swiss | 0.5 /100 | #261 | Tragic 17.3% |
| Immigrants | Zaire | 0.4 /100 | #262 | Tragic 17.3% |
| Lithuanians | 0.4 /100 | #263 | Tragic 17.3% |
| Slovenes | 0.3 /100 | #264 | Tragic 17.3% |
| Poles | 0.3 /100 | #265 | Tragic 17.3% |
| Jamaicans | 0.3 /100 | #266 | Tragic 17.3% |
| Haitians | 0.3 /100 | #267 | Tragic 17.3% |
| Immigrants | Caribbean | 0.3 /100 | #268 | Tragic 17.4% |
| Slavs | 0.3 /100 | #269 | Tragic 17.4% |
| Indonesians | 0.2 /100 | #270 | Tragic 17.4% |
| French American Indians | 0.2 /100 | #271 | Tragic 17.4% |
| Barbadians | 0.1 /100 | #272 | Tragic 17.5% |
| Italians | 0.1 /100 | #273 | Tragic 17.5% |