Sudanese vs Jamaican Disability Age 35 to 64
COMPARE
Sudanese
Jamaican
Disability Age 35 to 64
Disability Age 35 to 64 Comparison
Sudanese
Jamaicans
11.9%
DISABILITY AGE 35 TO 64
5.3/ 100
METRIC RATING
232nd/ 347
METRIC RANK
11.9%
DISABILITY AGE 35 TO 64
5.7/ 100
METRIC RATING
231st/ 347
METRIC RANK
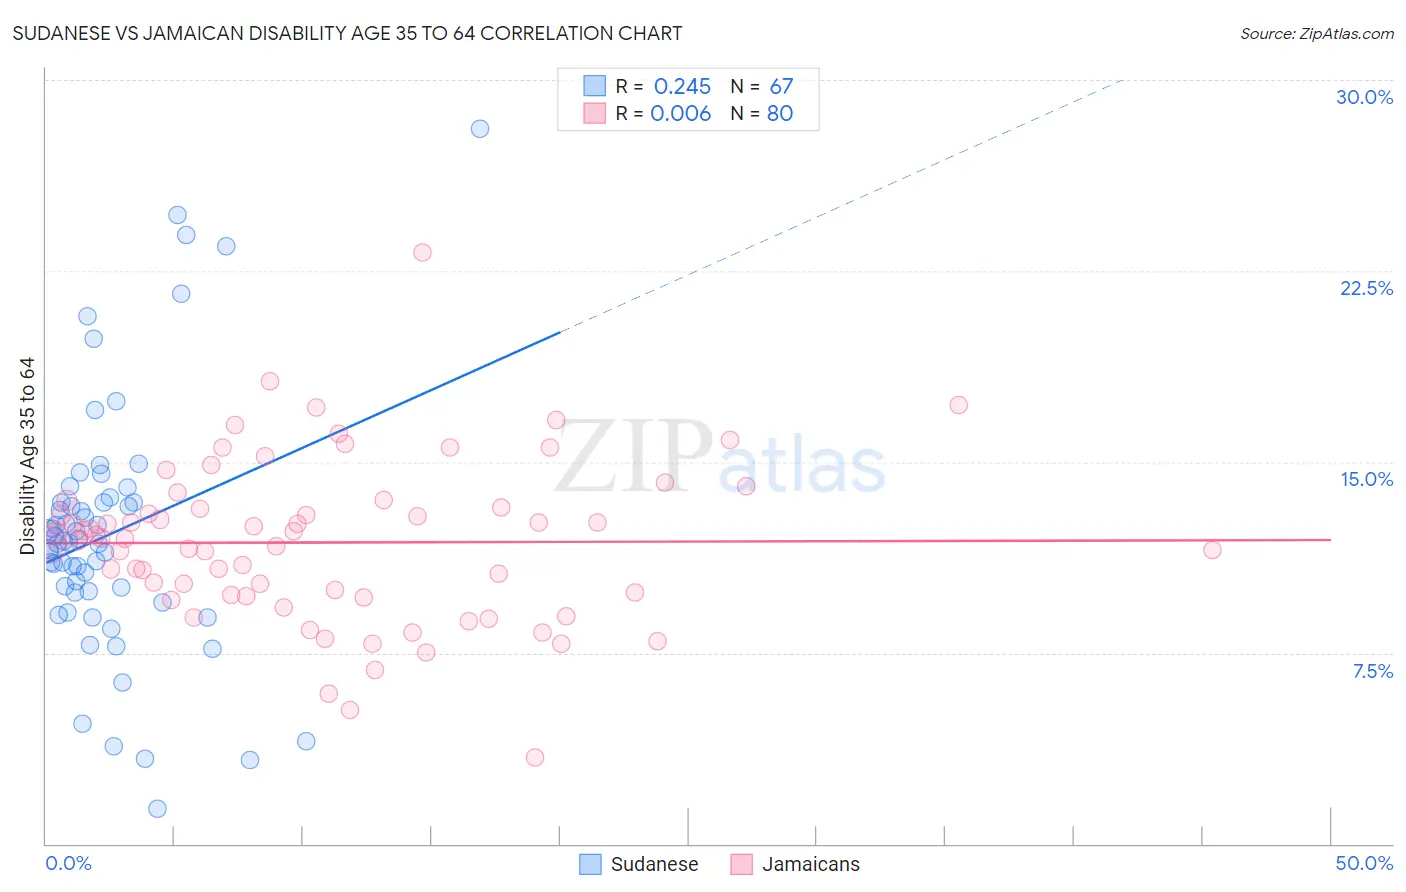
Sudanese vs Jamaican Disability Age 35 to 64 Correlation Chart
The statistical analysis conducted on geographies consisting of 110,102,872 people shows a weak positive correlation between the proportion of Sudanese and percentage of population with a disability between the ages 34 and 64 in the United States with a correlation coefficient (R) of 0.245 and weighted average of 11.9%. Similarly, the statistical analysis conducted on geographies consisting of 367,594,388 people shows no correlation between the proportion of Jamaicans and percentage of population with a disability between the ages 34 and 64 in the United States with a correlation coefficient (R) of 0.006 and weighted average of 11.9%, a difference of 0.14%.
Disability Age 35 to 64 Correlation Summary
| Measurement | Sudanese | Jamaican |
| Minimum | 1.4% | 3.4% |
| Maximum | 28.1% | 23.2% |
| Range | 26.7% | 19.9% |
| Mean | 12.2% | 11.8% |
| Median | 11.9% | 12.0% |
| Interquartile 25% (IQ1) | 9.9% | 9.7% |
| Interquartile 75% (IQ3) | 13.4% | 13.3% |
| Interquartile Range (IQR) | 3.5% | 3.6% |
| Standard Deviation (Sample) | 5.0% | 3.2% |
| Standard Deviation (Population) | 5.0% | 3.2% |
Demographics Similar to Sudanese and Jamaicans by Disability Age 35 to 64
In terms of disability age 35 to 64, the demographic groups most similar to Sudanese are Bermudan (11.9%, a difference of 0.11%), Panamanian (11.9%, a difference of 0.17%), Portuguese (11.9%, a difference of 0.18%), British West Indian (11.9%, a difference of 0.27%), and Immigrants from Germany (11.9%, a difference of 0.30%). Similarly, the demographic groups most similar to Jamaicans are Panamanian (11.9%, a difference of 0.030%), British West Indian (11.9%, a difference of 0.13%), Immigrants from Germany (11.9%, a difference of 0.15%), Immigrants from Central America (11.9%, a difference of 0.19%), and Scandinavian (11.9%, a difference of 0.22%).
| Demographics | Rating | Rank | Disability Age 35 to 64 |
| Alsatians | 8.5 /100 | #221 | Tragic 11.8% |
| Hondurans | 8.4 /100 | #222 | Tragic 11.8% |
| Immigrants | Honduras | 8.4 /100 | #223 | Tragic 11.8% |
| Immigrants | Ghana | 7.8 /100 | #224 | Tragic 11.8% |
| Immigrants | Belize | 6.6 /100 | #225 | Tragic 11.9% |
| Scandinavians | 6.4 /100 | #226 | Tragic 11.9% |
| Immigrants | Central America | 6.3 /100 | #227 | Tragic 11.9% |
| Immigrants | Germany | 6.2 /100 | #228 | Tragic 11.9% |
| British West Indians | 6.1 /100 | #229 | Tragic 11.9% |
| Panamanians | 5.8 /100 | #230 | Tragic 11.9% |
| Jamaicans | 5.7 /100 | #231 | Tragic 11.9% |
| Sudanese | 5.3 /100 | #232 | Tragic 11.9% |
| Bermudans | 5.0 /100 | #233 | Tragic 11.9% |
| Portuguese | 4.9 /100 | #234 | Tragic 11.9% |
| Belizeans | 4.5 /100 | #235 | Tragic 12.0% |
| Immigrants | Middle Africa | 4.5 /100 | #236 | Tragic 12.0% |
| Immigrants | Cambodia | 3.9 /100 | #237 | Tragic 12.0% |
| West Indians | 3.7 /100 | #238 | Tragic 12.0% |
| Immigrants | Western Africa | 3.3 /100 | #239 | Tragic 12.0% |
| Immigrants | Thailand | 3.3 /100 | #240 | Tragic 12.0% |
| Mexican American Indians | 3.2 /100 | #241 | Tragic 12.0% |