Haitian vs Immigrants from Bahamas Single Father Poverty
COMPARE
Haitian
Immigrants from Bahamas
Single Father Poverty
Single Father Poverty Comparison
Haitians
Immigrants from Bahamas
17.3%
SINGLE FATHER POVERTY
0.3/ 100
METRIC RATING
267th/ 347
METRIC RANK
18.1%
SINGLE FATHER POVERTY
0.0/ 100
METRIC RATING
292nd/ 347
METRIC RANK
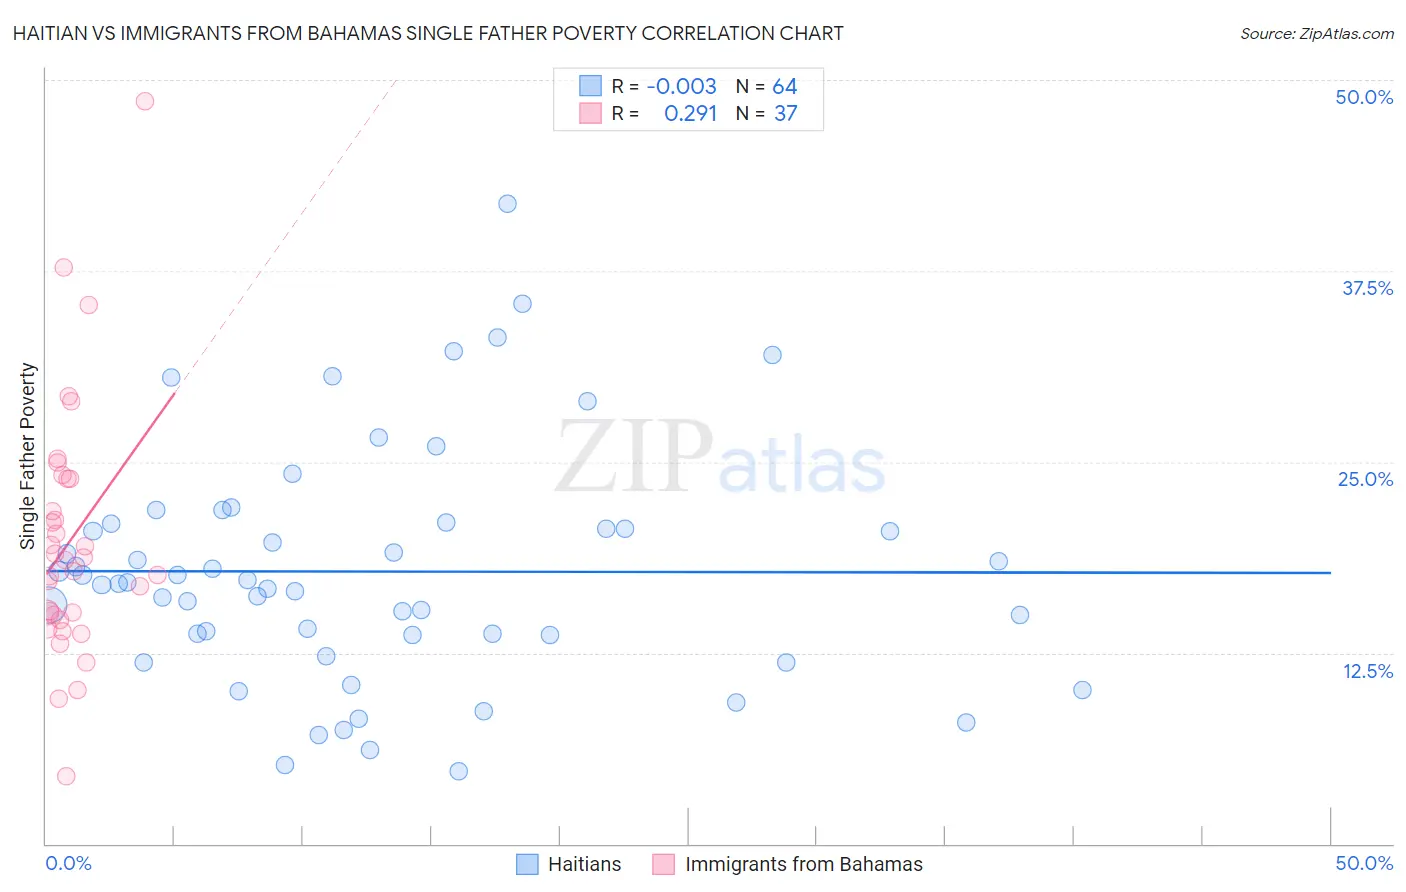
Haitian vs Immigrants from Bahamas Single Father Poverty Correlation Chart
The statistical analysis conducted on geographies consisting of 238,861,302 people shows no correlation between the proportion of Haitians and poverty level among single fathers in the United States with a correlation coefficient (R) of -0.003 and weighted average of 17.3%. Similarly, the statistical analysis conducted on geographies consisting of 96,162,173 people shows a weak positive correlation between the proportion of Immigrants from Bahamas and poverty level among single fathers in the United States with a correlation coefficient (R) of 0.291 and weighted average of 18.1%, a difference of 4.3%.
Single Father Poverty Correlation Summary
| Measurement | Haitian | Immigrants from Bahamas |
| Minimum | 4.7% | 4.5% |
| Maximum | 41.9% | 48.6% |
| Range | 37.1% | 44.1% |
| Mean | 17.8% | 19.9% |
| Median | 17.1% | 18.6% |
| Interquartile 25% (IQ1) | 13.7% | 14.8% |
| Interquartile 75% (IQ3) | 20.8% | 23.9% |
| Interquartile Range (IQR) | 7.1% | 9.1% |
| Standard Deviation (Sample) | 7.7% | 8.3% |
| Standard Deviation (Population) | 7.6% | 8.2% |
Similar Demographics by Single Father Poverty
Demographics Similar to Haitians by Single Father Poverty
In terms of single father poverty, the demographic groups most similar to Haitians are Jamaican (17.3%, a difference of 0.040%), Polish (17.3%, a difference of 0.090%), Slovene (17.3%, a difference of 0.10%), Immigrants from Caribbean (17.4%, a difference of 0.10%), and Slavic (17.4%, a difference of 0.17%).
| Demographics | Rating | Rank | Single Father Poverty |
| Spaniards | 0.6 /100 | #260 | Tragic 17.2% |
| Swiss | 0.5 /100 | #261 | Tragic 17.3% |
| Immigrants | Zaire | 0.4 /100 | #262 | Tragic 17.3% |
| Lithuanians | 0.4 /100 | #263 | Tragic 17.3% |
| Slovenes | 0.3 /100 | #264 | Tragic 17.3% |
| Poles | 0.3 /100 | #265 | Tragic 17.3% |
| Jamaicans | 0.3 /100 | #266 | Tragic 17.3% |
| Haitians | 0.3 /100 | #267 | Tragic 17.3% |
| Immigrants | Caribbean | 0.3 /100 | #268 | Tragic 17.4% |
| Slavs | 0.3 /100 | #269 | Tragic 17.4% |
| Indonesians | 0.2 /100 | #270 | Tragic 17.4% |
| French American Indians | 0.2 /100 | #271 | Tragic 17.4% |
| Barbadians | 0.1 /100 | #272 | Tragic 17.5% |
| Italians | 0.1 /100 | #273 | Tragic 17.5% |
| Macedonians | 0.1 /100 | #274 | Tragic 17.7% |
Demographics Similar to Immigrants from Bahamas by Single Father Poverty
In terms of single father poverty, the demographic groups most similar to Immigrants from Bahamas are Alaskan Athabascan (18.1%, a difference of 0.010%), Alaska Native (18.1%, a difference of 0.11%), U.S. Virgin Islander (18.1%, a difference of 0.13%), Yakama (18.1%, a difference of 0.20%), and West Indian (18.0%, a difference of 0.23%).
| Demographics | Rating | Rank | Single Father Poverty |
| Immigrants | Lebanon | 0.0 /100 | #285 | Tragic 17.9% |
| Immigrants | North Macedonia | 0.0 /100 | #286 | Tragic 17.9% |
| Carpatho Rusyns | 0.0 /100 | #287 | Tragic 18.0% |
| Bahamians | 0.0 /100 | #288 | Tragic 18.0% |
| Irish | 0.0 /100 | #289 | Tragic 18.0% |
| West Indians | 0.0 /100 | #290 | Tragic 18.0% |
| Alaskan Athabascans | 0.0 /100 | #291 | Tragic 18.1% |
| Immigrants | Bahamas | 0.0 /100 | #292 | Tragic 18.1% |
| Alaska Natives | 0.0 /100 | #293 | Tragic 18.1% |
| U.S. Virgin Islanders | 0.0 /100 | #294 | Tragic 18.1% |
| Yakama | 0.0 /100 | #295 | Tragic 18.1% |
| Seminole | 0.0 /100 | #296 | Tragic 18.1% |
| French | 0.0 /100 | #297 | Tragic 18.2% |
| Africans | 0.0 /100 | #298 | Tragic 18.3% |
| Whites/Caucasians | 0.0 /100 | #299 | Tragic 18.4% |