Cree vs Immigrants from Bahamas Single Father Poverty
COMPARE
Cree
Immigrants from Bahamas
Single Father Poverty
Single Father Poverty Comparison
Cree
Immigrants from Bahamas
17.1%
SINGLE FATHER POVERTY
1.0/ 100
METRIC RATING
253rd/ 347
METRIC RANK
18.1%
SINGLE FATHER POVERTY
0.0/ 100
METRIC RATING
292nd/ 347
METRIC RANK
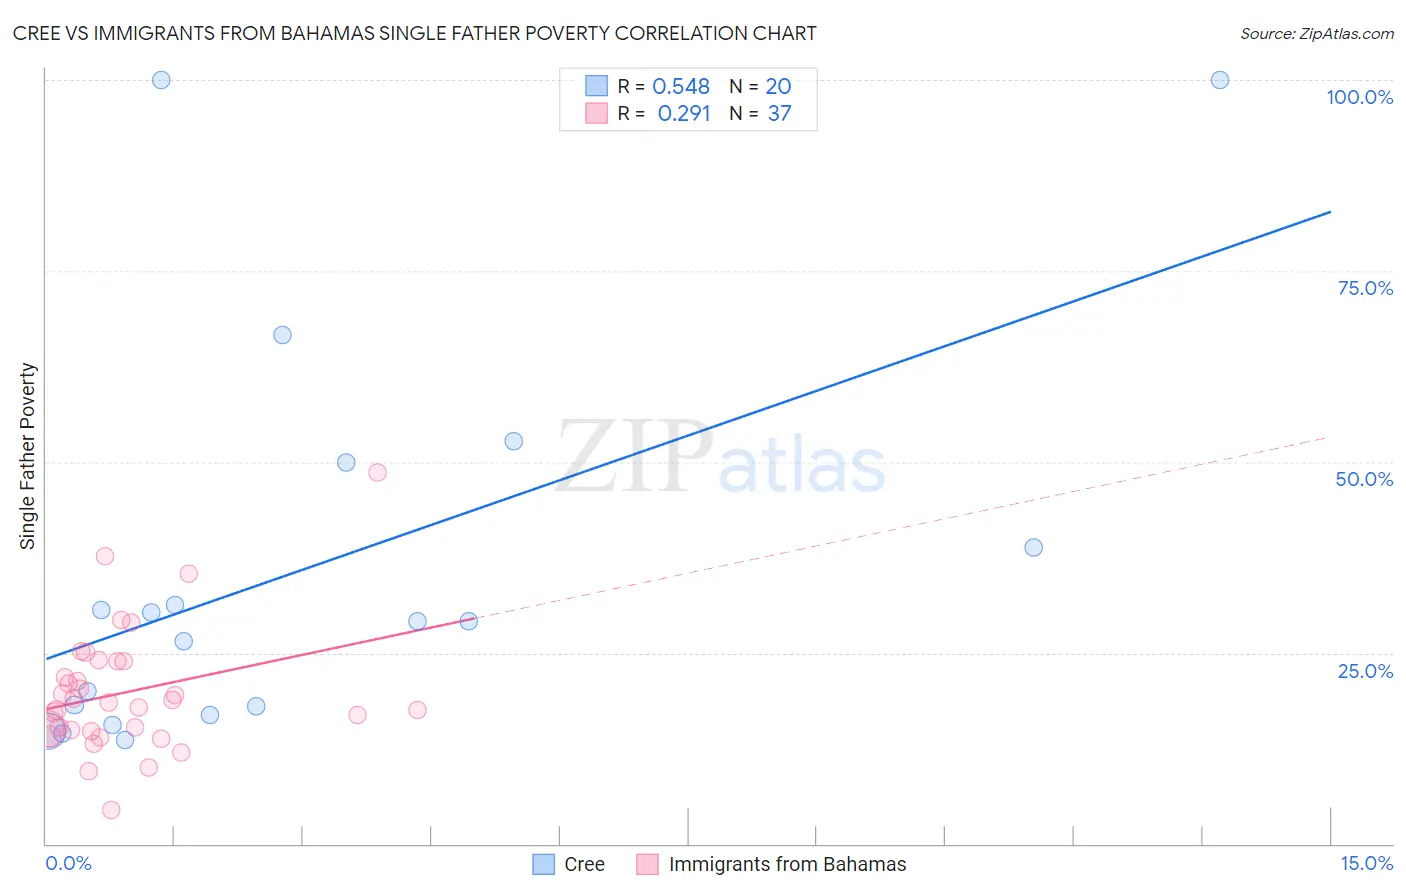
Cree vs Immigrants from Bahamas Single Father Poverty Correlation Chart
The statistical analysis conducted on geographies consisting of 70,905,004 people shows a substantial positive correlation between the proportion of Cree and poverty level among single fathers in the United States with a correlation coefficient (R) of 0.548 and weighted average of 17.1%. Similarly, the statistical analysis conducted on geographies consisting of 96,162,173 people shows a weak positive correlation between the proportion of Immigrants from Bahamas and poverty level among single fathers in the United States with a correlation coefficient (R) of 0.291 and weighted average of 18.1%, a difference of 5.7%.
Single Father Poverty Correlation Summary
| Measurement | Cree | Immigrants from Bahamas |
| Minimum | 13.5% | 4.5% |
| Maximum | 100.0% | 48.6% |
| Range | 86.5% | 44.1% |
| Mean | 35.8% | 19.9% |
| Median | 29.2% | 18.6% |
| Interquartile 25% (IQ1) | 17.4% | 14.8% |
| Interquartile 75% (IQ3) | 44.4% | 23.9% |
| Interquartile Range (IQR) | 26.9% | 9.1% |
| Standard Deviation (Sample) | 26.1% | 8.3% |
| Standard Deviation (Population) | 25.5% | 8.2% |
Similar Demographics by Single Father Poverty
Demographics Similar to Cree by Single Father Poverty
In terms of single father poverty, the demographic groups most similar to Cree are Croatian (17.1%, a difference of 0.010%), Austrian (17.1%, a difference of 0.11%), Luxembourger (17.1%, a difference of 0.11%), Immigrants from Honduras (17.1%, a difference of 0.12%), and Canadian (17.1%, a difference of 0.25%).
| Demographics | Rating | Rank | Single Father Poverty |
| Immigrants | Ireland | 1.4 /100 | #246 | Tragic 17.1% |
| Greeks | 1.3 /100 | #247 | Tragic 17.1% |
| Czechoslovakians | 1.3 /100 | #248 | Tragic 17.1% |
| Canadians | 1.3 /100 | #249 | Tragic 17.1% |
| Austrians | 1.1 /100 | #250 | Tragic 17.1% |
| Luxembourgers | 1.1 /100 | #251 | Tragic 17.1% |
| Croatians | 1.0 /100 | #252 | Tragic 17.1% |
| Cree | 1.0 /100 | #253 | Tragic 17.1% |
| Immigrants | Honduras | 0.9 /100 | #254 | Tragic 17.1% |
| Sierra Leoneans | 0.8 /100 | #255 | Tragic 17.2% |
| Immigrants | Haiti | 0.8 /100 | #256 | Tragic 17.2% |
| Immigrants | Albania | 0.7 /100 | #257 | Tragic 17.2% |
| Albanians | 0.7 /100 | #258 | Tragic 17.2% |
| Immigrants | Jamaica | 0.7 /100 | #259 | Tragic 17.2% |
| Spaniards | 0.6 /100 | #260 | Tragic 17.2% |
Demographics Similar to Immigrants from Bahamas by Single Father Poverty
In terms of single father poverty, the demographic groups most similar to Immigrants from Bahamas are Alaskan Athabascan (18.1%, a difference of 0.010%), Alaska Native (18.1%, a difference of 0.11%), U.S. Virgin Islander (18.1%, a difference of 0.13%), Yakama (18.1%, a difference of 0.20%), and West Indian (18.0%, a difference of 0.23%).
| Demographics | Rating | Rank | Single Father Poverty |
| Immigrants | Lebanon | 0.0 /100 | #285 | Tragic 17.9% |
| Immigrants | North Macedonia | 0.0 /100 | #286 | Tragic 17.9% |
| Carpatho Rusyns | 0.0 /100 | #287 | Tragic 18.0% |
| Bahamians | 0.0 /100 | #288 | Tragic 18.0% |
| Irish | 0.0 /100 | #289 | Tragic 18.0% |
| West Indians | 0.0 /100 | #290 | Tragic 18.0% |
| Alaskan Athabascans | 0.0 /100 | #291 | Tragic 18.1% |
| Immigrants | Bahamas | 0.0 /100 | #292 | Tragic 18.1% |
| Alaska Natives | 0.0 /100 | #293 | Tragic 18.1% |
| U.S. Virgin Islanders | 0.0 /100 | #294 | Tragic 18.1% |
| Yakama | 0.0 /100 | #295 | Tragic 18.1% |
| Seminole | 0.0 /100 | #296 | Tragic 18.1% |
| French | 0.0 /100 | #297 | Tragic 18.2% |
| Africans | 0.0 /100 | #298 | Tragic 18.3% |
| Whites/Caucasians | 0.0 /100 | #299 | Tragic 18.4% |