Sudanese vs Ecuadorian Family Households with Children
COMPARE
Sudanese
Ecuadorian
Family Households with Children
Family Households with Children Comparison
Sudanese
Ecuadorians
27.4%
FAMILY HOUSEHOLDS WITH CHILDREN
37.6/ 100
METRIC RATING
191st/ 347
METRIC RANK
27.8%
FAMILY HOUSEHOLDS WITH CHILDREN
90.8/ 100
METRIC RATING
125th/ 347
METRIC RANK
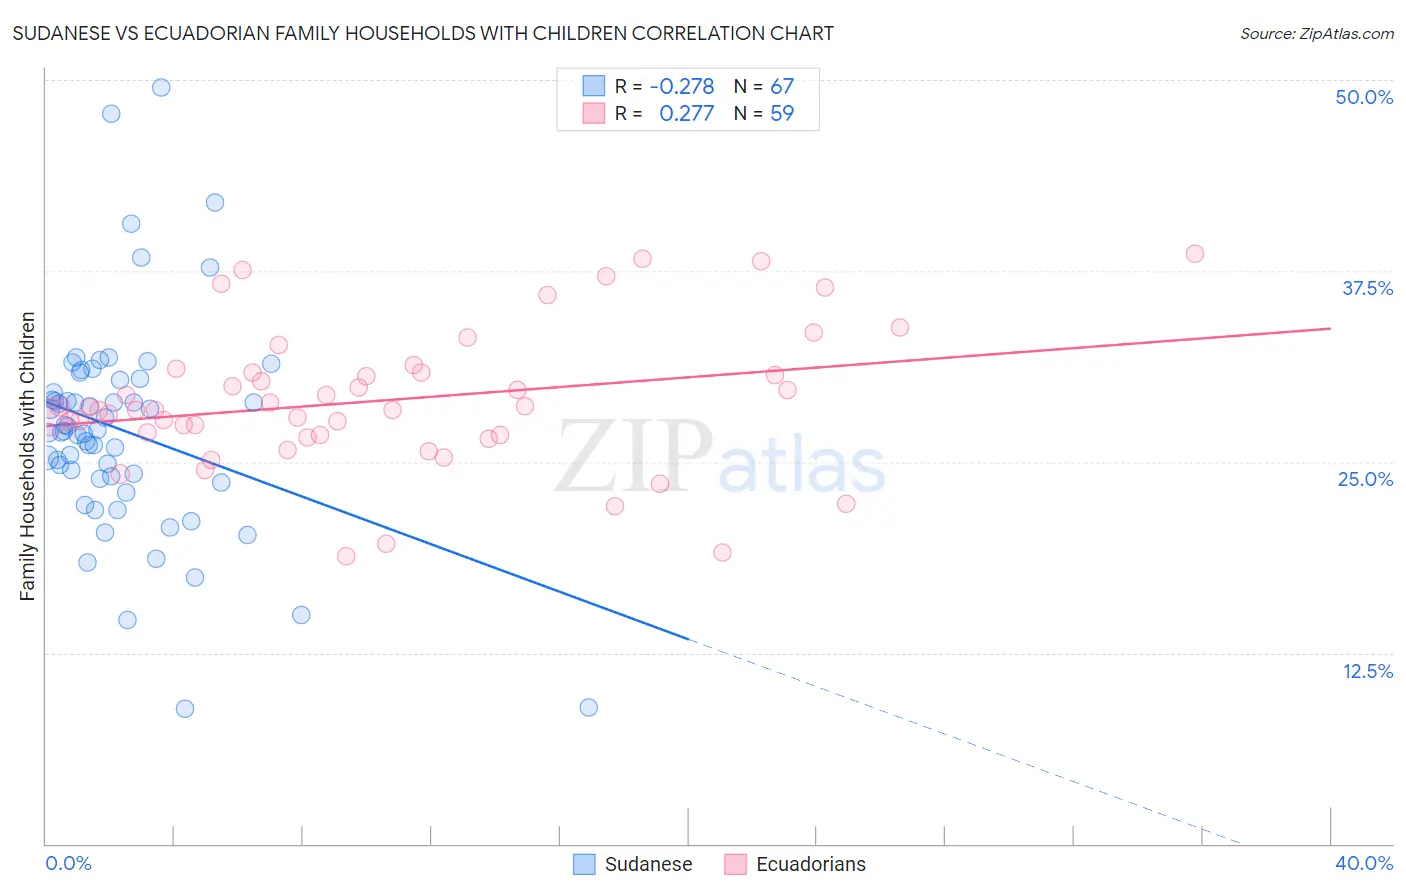
Sudanese vs Ecuadorian Family Households with Children Correlation Chart
The statistical analysis conducted on geographies consisting of 110,102,819 people shows a weak negative correlation between the proportion of Sudanese and percentage of family households with children in the United States with a correlation coefficient (R) of -0.278 and weighted average of 27.4%. Similarly, the statistical analysis conducted on geographies consisting of 317,541,400 people shows a weak positive correlation between the proportion of Ecuadorians and percentage of family households with children in the United States with a correlation coefficient (R) of 0.277 and weighted average of 27.8%, a difference of 1.5%.
Family Households with Children Correlation Summary
| Measurement | Sudanese | Ecuadorian |
| Minimum | 8.8% | 18.8% |
| Maximum | 49.5% | 38.7% |
| Range | 40.7% | 19.9% |
| Mean | 27.1% | 29.0% |
| Median | 27.0% | 28.4% |
| Interquartile 25% (IQ1) | 23.9% | 26.7% |
| Interquartile 75% (IQ3) | 30.4% | 30.9% |
| Interquartile Range (IQR) | 6.4% | 4.1% |
| Standard Deviation (Sample) | 7.1% | 4.6% |
| Standard Deviation (Population) | 7.1% | 4.5% |
Similar Demographics by Family Households with Children
Demographics Similar to Sudanese by Family Households with Children
In terms of family households with children, the demographic groups most similar to Sudanese are Immigrants from Uruguay (27.4%, a difference of 0.0%), Pennsylvania German (27.4%, a difference of 0.0%), Immigrants from Israel (27.4%, a difference of 0.010%), Swedish (27.4%, a difference of 0.020%), and Dutch (27.4%, a difference of 0.030%).
| Demographics | Rating | Rank | Family Households with Children |
| Native Hawaiians | 44.6 /100 | #184 | Average 27.4% |
| Delaware | 42.0 /100 | #185 | Average 27.4% |
| Immigrants | Brazil | 40.6 /100 | #186 | Average 27.4% |
| Creek | 39.8 /100 | #187 | Fair 27.4% |
| Dutch | 38.8 /100 | #188 | Fair 27.4% |
| Immigrants | Israel | 37.9 /100 | #189 | Fair 27.4% |
| Immigrants | Uruguay | 37.7 /100 | #190 | Fair 27.4% |
| Sudanese | 37.6 /100 | #191 | Fair 27.4% |
| Pennsylvania Germans | 37.5 /100 | #192 | Fair 27.4% |
| Swedes | 36.9 /100 | #193 | Fair 27.4% |
| Immigrants | Iran | 36.1 /100 | #194 | Fair 27.4% |
| Crow | 35.7 /100 | #195 | Fair 27.4% |
| Cheyenne | 35.1 /100 | #196 | Fair 27.4% |
| Norwegians | 35.0 /100 | #197 | Fair 27.4% |
| Immigrants | Romania | 34.4 /100 | #198 | Fair 27.4% |
Demographics Similar to Ecuadorians by Family Households with Children
In terms of family households with children, the demographic groups most similar to Ecuadorians are Immigrants from Singapore (27.8%, a difference of 0.0%), Immigrants from Ethiopia (27.8%, a difference of 0.020%), Belizean (27.8%, a difference of 0.050%), Immigrants from Northern Africa (27.8%, a difference of 0.070%), and Syrian (27.8%, a difference of 0.070%).
| Demographics | Rating | Rank | Family Households with Children |
| Central American Indians | 95.9 /100 | #118 | Exceptional 27.9% |
| Zimbabweans | 95.6 /100 | #119 | Exceptional 27.9% |
| Europeans | 95.4 /100 | #120 | Exceptional 27.9% |
| Immigrants | Western Asia | 93.6 /100 | #121 | Exceptional 27.9% |
| Immigrants | Zimbabwe | 92.8 /100 | #122 | Exceptional 27.8% |
| Immigrants | Northern Africa | 91.8 /100 | #123 | Exceptional 27.8% |
| Immigrants | Singapore | 90.8 /100 | #124 | Exceptional 27.8% |
| Ecuadorians | 90.8 /100 | #125 | Exceptional 27.8% |
| Immigrants | Ethiopia | 90.5 /100 | #126 | Exceptional 27.8% |
| Belizeans | 90.0 /100 | #127 | Exceptional 27.8% |
| Syrians | 89.7 /100 | #128 | Excellent 27.8% |
| Immigrants | Eritrea | 89.4 /100 | #129 | Excellent 27.8% |
| Cajuns | 87.6 /100 | #130 | Excellent 27.7% |
| Lebanese | 87.4 /100 | #131 | Excellent 27.7% |
| Immigrants | Belize | 85.7 /100 | #132 | Excellent 27.7% |