Subsaharan African vs Russian 4th Grade
COMPARE
Subsaharan African
Russian
4th Grade
4th Grade Comparison
Sub-Saharan Africans
Russians
97.2%
4TH GRADE
3.6/ 100
METRIC RATING
228th/ 347
METRIC RANK
98.0%
4TH GRADE
99.7/ 100
METRIC RATING
63rd/ 347
METRIC RANK
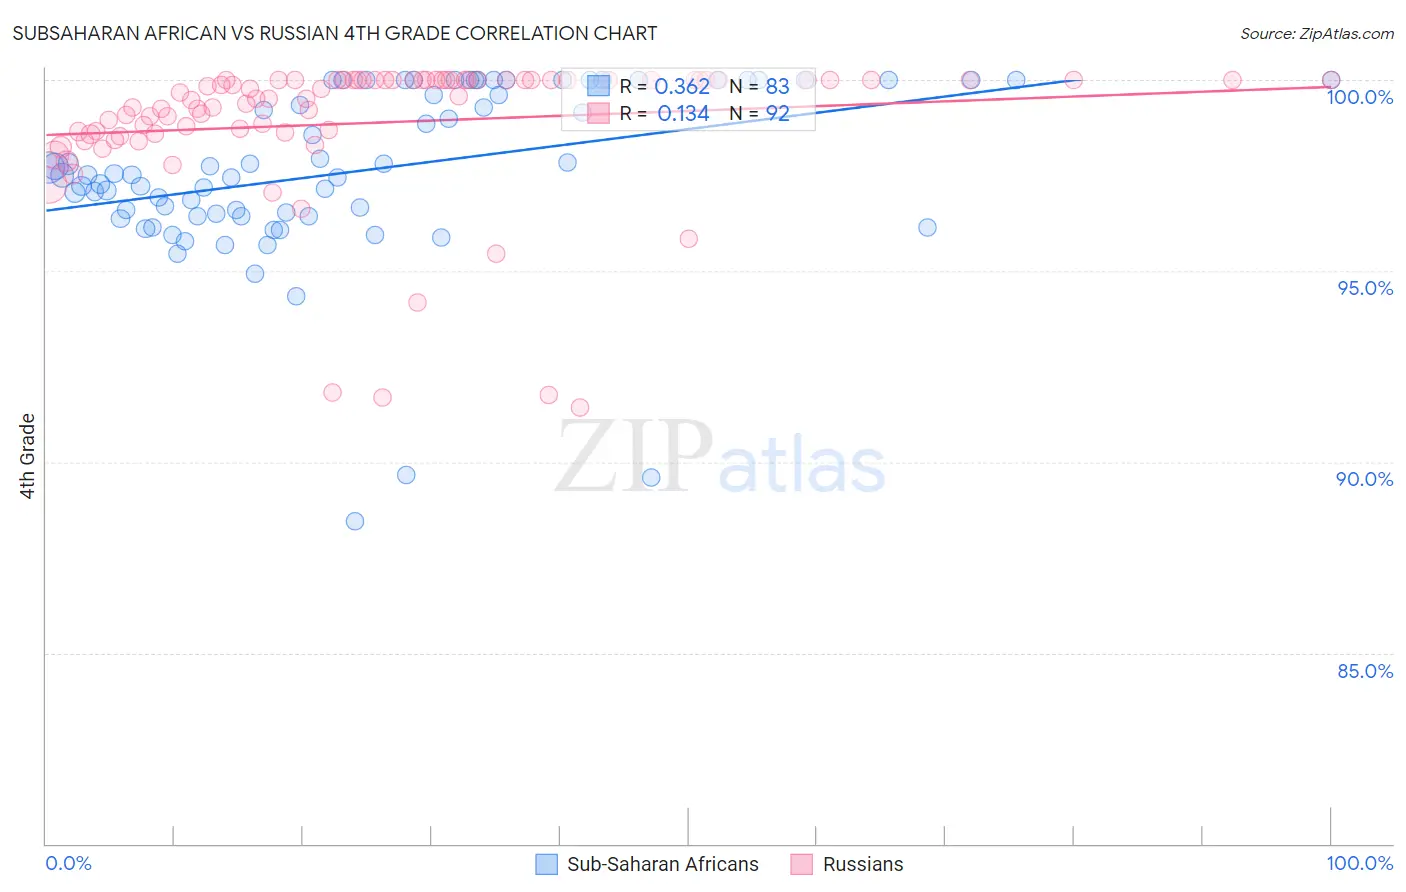
Subsaharan African vs Russian 4th Grade Correlation Chart
The statistical analysis conducted on geographies consisting of 508,209,362 people shows a mild positive correlation between the proportion of Sub-Saharan Africans and percentage of population with at least 4th grade education in the United States with a correlation coefficient (R) of 0.362 and weighted average of 97.2%. Similarly, the statistical analysis conducted on geographies consisting of 512,259,139 people shows a poor positive correlation between the proportion of Russians and percentage of population with at least 4th grade education in the United States with a correlation coefficient (R) of 0.134 and weighted average of 98.0%, a difference of 0.85%.
4th Grade Correlation Summary
| Measurement | Subsaharan African | Russian |
| Minimum | 88.4% | 91.4% |
| Maximum | 100.0% | 100.0% |
| Range | 11.6% | 8.6% |
| Mean | 97.6% | 98.9% |
| Median | 97.5% | 99.5% |
| Interquartile 25% (IQ1) | 96.4% | 98.6% |
| Interquartile 75% (IQ3) | 100.0% | 100.0% |
| Interquartile Range (IQR) | 3.6% | 1.4% |
| Standard Deviation (Sample) | 2.3% | 1.9% |
| Standard Deviation (Population) | 2.3% | 1.9% |
Similar Demographics by 4th Grade
Demographics Similar to Sub-Saharan Africans by 4th Grade
In terms of 4th grade, the demographic groups most similar to Sub-Saharan Africans are Immigrants from Pakistan (97.2%, a difference of 0.0%), Liberian (97.2%, a difference of 0.0%), Uruguayan (97.2%, a difference of 0.0%), Bahamian (97.2%, a difference of 0.010%), and Immigrants from Malaysia (97.2%, a difference of 0.010%).
| Demographics | Rating | Rank | 4th Grade |
| Immigrants | Panama | 5.4 /100 | #221 | Tragic 97.3% |
| Immigrants | Lebanon | 5.1 /100 | #222 | Tragic 97.3% |
| Immigrants | Sudan | 5.0 /100 | #223 | Tragic 97.2% |
| Immigrants | Syria | 5.0 /100 | #224 | Tragic 97.2% |
| Immigrants | Iraq | 4.6 /100 | #225 | Tragic 97.2% |
| Bahamians | 3.8 /100 | #226 | Tragic 97.2% |
| Immigrants | Pakistan | 3.7 /100 | #227 | Tragic 97.2% |
| Sub-Saharan Africans | 3.6 /100 | #228 | Tragic 97.2% |
| Liberians | 3.6 /100 | #229 | Tragic 97.2% |
| Uruguayans | 3.5 /100 | #230 | Tragic 97.2% |
| Immigrants | Malaysia | 3.4 /100 | #231 | Tragic 97.2% |
| Immigrants | Western Asia | 3.4 /100 | #232 | Tragic 97.2% |
| Senegalese | 3.1 /100 | #233 | Tragic 97.2% |
| Assyrians/Chaldeans/Syriacs | 3.0 /100 | #234 | Tragic 97.2% |
| Yuman | 2.9 /100 | #235 | Tragic 97.2% |
Demographics Similar to Russians by 4th Grade
In terms of 4th grade, the demographic groups most similar to Russians are Immigrants from Canada (98.1%, a difference of 0.010%), Immigrants from North America (98.1%, a difference of 0.010%), Serbian (98.1%, a difference of 0.010%), Cajun (98.0%, a difference of 0.010%), and Immigrants from Northern Europe (98.0%, a difference of 0.010%).
| Demographics | Rating | Rank | 4th Grade |
| Greeks | 99.8 /100 | #56 | Exceptional 98.1% |
| Austrians | 99.8 /100 | #57 | Exceptional 98.1% |
| Creek | 99.8 /100 | #58 | Exceptional 98.1% |
| Americans | 99.8 /100 | #59 | Exceptional 98.1% |
| Immigrants | Canada | 99.7 /100 | #60 | Exceptional 98.1% |
| Immigrants | North America | 99.7 /100 | #61 | Exceptional 98.1% |
| Serbians | 99.7 /100 | #62 | Exceptional 98.1% |
| Russians | 99.7 /100 | #63 | Exceptional 98.0% |
| Cajuns | 99.7 /100 | #64 | Exceptional 98.0% |
| Immigrants | Northern Europe | 99.6 /100 | #65 | Exceptional 98.0% |
| Canadians | 99.6 /100 | #66 | Exceptional 98.0% |
| New Zealanders | 99.6 /100 | #67 | Exceptional 98.0% |
| Kiowa | 99.6 /100 | #68 | Exceptional 98.0% |
| Pueblo | 99.6 /100 | #69 | Exceptional 98.0% |
| Immigrants | Austria | 99.6 /100 | #70 | Exceptional 98.0% |