Guamanian/Chamorro vs Russian Child Poverty Among Girls Under 16
COMPARE
Guamanian/Chamorro
Russian
Child Poverty Among Girls Under 16
Child Poverty Among Girls Under 16 Comparison
Guamanians/Chamorros
Russians
15.9%
CHILD POVERTY AMONG GIRLS UNDER 16
75.3/ 100
METRIC RATING
158th/ 347
METRIC RANK
13.9%
CHILD POVERTY AMONG GIRLS UNDER 16
99.6/ 100
METRIC RATING
36th/ 347
METRIC RANK
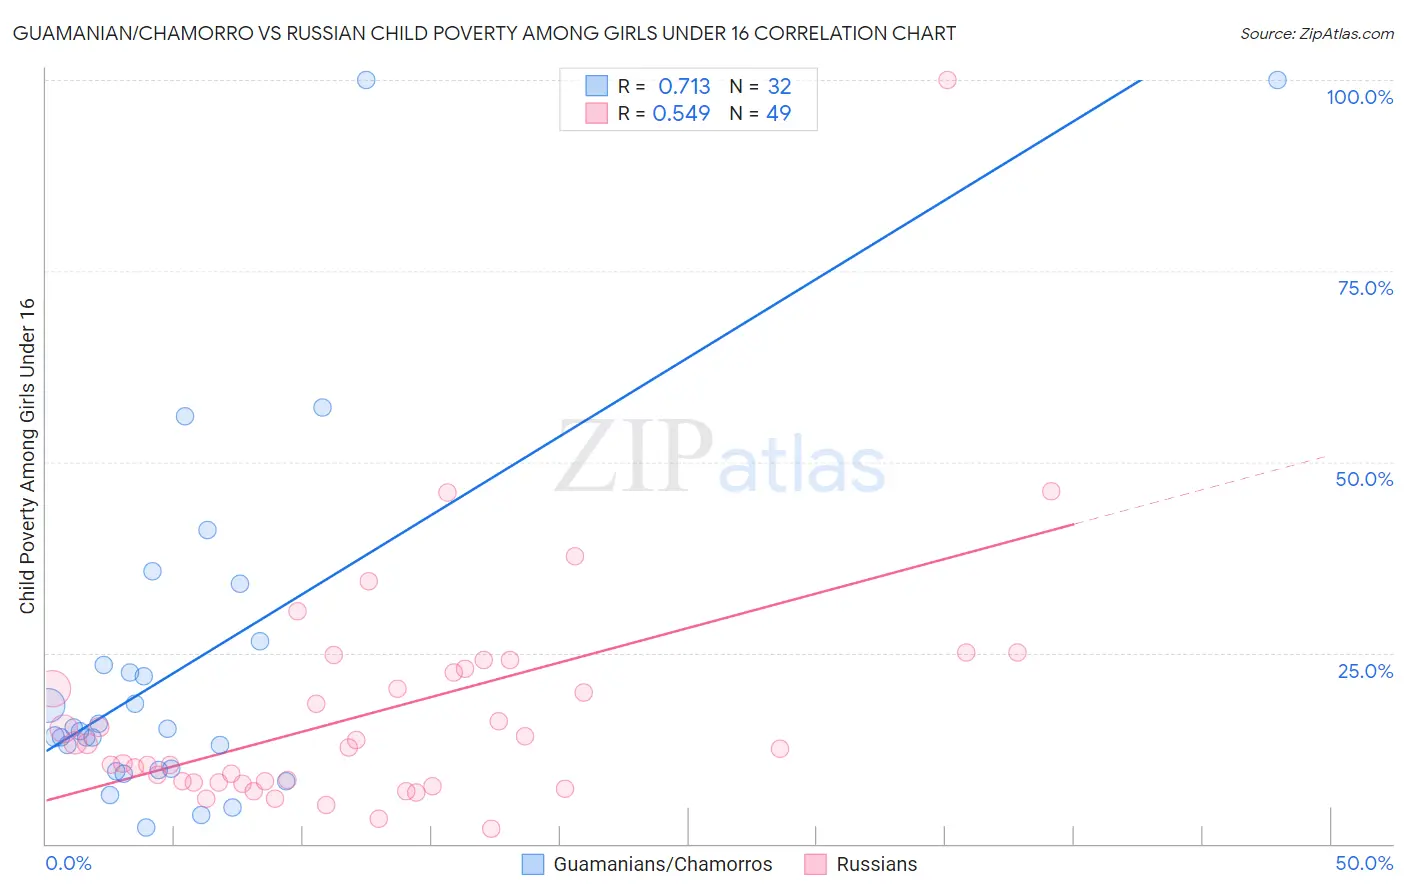
Guamanian/Chamorro vs Russian Child Poverty Among Girls Under 16 Correlation Chart
The statistical analysis conducted on geographies consisting of 220,387,643 people shows a strong positive correlation between the proportion of Guamanians/Chamorros and poverty level among girls under the age of 16 in the United States with a correlation coefficient (R) of 0.713 and weighted average of 15.9%. Similarly, the statistical analysis conducted on geographies consisting of 495,383,256 people shows a substantial positive correlation between the proportion of Russians and poverty level among girls under the age of 16 in the United States with a correlation coefficient (R) of 0.549 and weighted average of 13.9%, a difference of 15.0%.
Child Poverty Among Girls Under 16 Correlation Summary
| Measurement | Guamanian/Chamorro | Russian |
| Minimum | 2.0% | 1.9% |
| Maximum | 100.0% | 100.0% |
| Range | 98.0% | 98.1% |
| Mean | 23.8% | 17.2% |
| Median | 14.9% | 12.5% |
| Interquartile 25% (IQ1) | 9.7% | 8.0% |
| Interquartile 75% (IQ3) | 24.9% | 22.6% |
| Interquartile Range (IQR) | 15.2% | 14.6% |
| Standard Deviation (Sample) | 24.0% | 15.9% |
| Standard Deviation (Population) | 23.7% | 15.7% |
Similar Demographics by Child Poverty Among Girls Under 16
Demographics Similar to Guamanians/Chamorros by Child Poverty Among Girls Under 16
In terms of child poverty among girls under 16, the demographic groups most similar to Guamanians/Chamorros are Slovak (15.9%, a difference of 0.010%), Immigrants from Fiji (15.9%, a difference of 0.12%), Colombian (15.9%, a difference of 0.12%), Syrian (15.9%, a difference of 0.22%), and Immigrants from Chile (15.9%, a difference of 0.23%).
| Demographics | Rating | Rank | Child Poverty Among Girls Under 16 |
| Venezuelans | 80.1 /100 | #151 | Excellent 15.8% |
| Immigrants | Kuwait | 79.4 /100 | #152 | Good 15.8% |
| Immigrants | Nepal | 78.5 /100 | #153 | Good 15.9% |
| Immigrants | Chile | 76.7 /100 | #154 | Good 15.9% |
| Syrians | 76.7 /100 | #155 | Good 15.9% |
| Immigrants | Fiji | 76.1 /100 | #156 | Good 15.9% |
| Colombians | 76.1 /100 | #157 | Good 15.9% |
| Guamanians/Chamorros | 75.3 /100 | #158 | Good 15.9% |
| Slovaks | 75.2 /100 | #159 | Good 15.9% |
| French | 72.8 /100 | #160 | Good 16.0% |
| Immigrants | Northern Africa | 72.0 /100 | #161 | Good 16.0% |
| French Canadians | 68.7 /100 | #162 | Good 16.1% |
| Immigrants | Oceania | 68.4 /100 | #163 | Good 16.1% |
| Immigrants | Colombia | 67.8 /100 | #164 | Good 16.1% |
| Immigrants | Germany | 67.3 /100 | #165 | Good 16.1% |
Demographics Similar to Russians by Child Poverty Among Girls Under 16
In terms of child poverty among girls under 16, the demographic groups most similar to Russians are Lithuanian (13.9%, a difference of 0.020%), Immigrants from Northern Europe (13.8%, a difference of 0.15%), Immigrants from Moldova (13.9%, a difference of 0.32%), Immigrants from Australia (14.0%, a difference of 0.97%), and Immigrants from Sri Lanka (14.0%, a difference of 1.1%).
| Demographics | Rating | Rank | Child Poverty Among Girls Under 16 |
| Bolivians | 99.8 /100 | #29 | Exceptional 13.6% |
| Asians | 99.7 /100 | #30 | Exceptional 13.7% |
| Turks | 99.7 /100 | #31 | Exceptional 13.7% |
| Danes | 99.7 /100 | #32 | Exceptional 13.7% |
| Swedes | 99.7 /100 | #33 | Exceptional 13.7% |
| Maltese | 99.7 /100 | #34 | Exceptional 13.7% |
| Immigrants | Northern Europe | 99.6 /100 | #35 | Exceptional 13.8% |
| Russians | 99.6 /100 | #36 | Exceptional 13.9% |
| Lithuanians | 99.6 /100 | #37 | Exceptional 13.9% |
| Immigrants | Moldova | 99.6 /100 | #38 | Exceptional 13.9% |
| Immigrants | Australia | 99.5 /100 | #39 | Exceptional 14.0% |
| Immigrants | Sri Lanka | 99.5 /100 | #40 | Exceptional 14.0% |
| Immigrants | Bolivia | 99.5 /100 | #41 | Exceptional 14.0% |
| Immigrants | Scotland | 99.4 /100 | #42 | Exceptional 14.0% |
| Koreans | 99.4 /100 | #43 | Exceptional 14.1% |