Tongan vs Russian Child Poverty Among Girls Under 16
COMPARE
Tongan
Russian
Child Poverty Among Girls Under 16
Child Poverty Among Girls Under 16 Comparison
Tongans
Russians
13.6%
CHILD POVERTY AMONG GIRLS UNDER 16
99.8/ 100
METRIC RATING
28th/ 347
METRIC RANK
13.9%
CHILD POVERTY AMONG GIRLS UNDER 16
99.6/ 100
METRIC RATING
36th/ 347
METRIC RANK
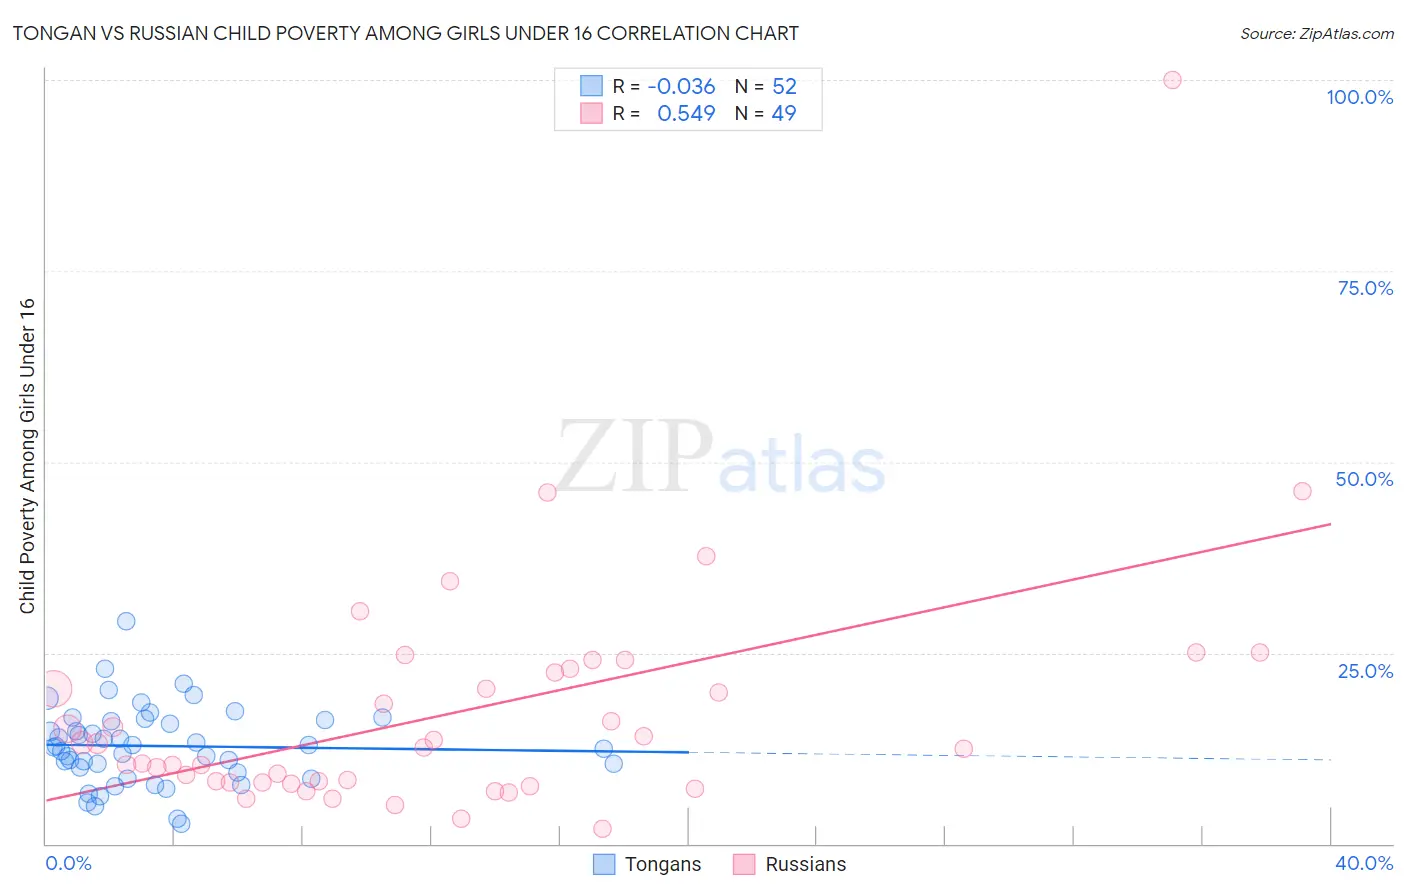
Tongan vs Russian Child Poverty Among Girls Under 16 Correlation Chart
The statistical analysis conducted on geographies consisting of 102,473,172 people shows no correlation between the proportion of Tongans and poverty level among girls under the age of 16 in the United States with a correlation coefficient (R) of -0.036 and weighted average of 13.6%. Similarly, the statistical analysis conducted on geographies consisting of 495,383,256 people shows a substantial positive correlation between the proportion of Russians and poverty level among girls under the age of 16 in the United States with a correlation coefficient (R) of 0.549 and weighted average of 13.9%, a difference of 2.2%.
Child Poverty Among Girls Under 16 Correlation Summary
| Measurement | Tongan | Russian |
| Minimum | 2.7% | 1.9% |
| Maximum | 29.2% | 100.0% |
| Range | 26.5% | 98.1% |
| Mean | 12.8% | 17.2% |
| Median | 12.7% | 12.5% |
| Interquartile 25% (IQ1) | 9.7% | 8.0% |
| Interquartile 75% (IQ3) | 16.1% | 22.6% |
| Interquartile Range (IQR) | 6.4% | 14.6% |
| Standard Deviation (Sample) | 5.1% | 15.9% |
| Standard Deviation (Population) | 5.0% | 15.7% |
Demographics Similar to Tongans and Russians by Child Poverty Among Girls Under 16
In terms of child poverty among girls under 16, the demographic groups most similar to Tongans are Bolivian (13.6%, a difference of 0.12%), Latvian (13.5%, a difference of 0.26%), Eastern European (13.5%, a difference of 0.28%), Asian (13.7%, a difference of 0.79%), and Turkish (13.7%, a difference of 0.91%). Similarly, the demographic groups most similar to Russians are Lithuanian (13.9%, a difference of 0.020%), Immigrants from Northern Europe (13.8%, a difference of 0.15%), Immigrants from Moldova (13.9%, a difference of 0.32%), Immigrants from Australia (14.0%, a difference of 0.97%), and Immigrants from Sri Lanka (14.0%, a difference of 1.1%).
| Demographics | Rating | Rank | Child Poverty Among Girls Under 16 |
| Indians (Asian) | 99.9 /100 | #22 | Exceptional 13.3% |
| Norwegians | 99.9 /100 | #23 | Exceptional 13.3% |
| Immigrants | Eastern Asia | 99.9 /100 | #24 | Exceptional 13.4% |
| Immigrants | China | 99.8 /100 | #25 | Exceptional 13.4% |
| Eastern Europeans | 99.8 /100 | #26 | Exceptional 13.5% |
| Latvians | 99.8 /100 | #27 | Exceptional 13.5% |
| Tongans | 99.8 /100 | #28 | Exceptional 13.6% |
| Bolivians | 99.8 /100 | #29 | Exceptional 13.6% |
| Asians | 99.7 /100 | #30 | Exceptional 13.7% |
| Turks | 99.7 /100 | #31 | Exceptional 13.7% |
| Danes | 99.7 /100 | #32 | Exceptional 13.7% |
| Swedes | 99.7 /100 | #33 | Exceptional 13.7% |
| Maltese | 99.7 /100 | #34 | Exceptional 13.7% |
| Immigrants | Northern Europe | 99.6 /100 | #35 | Exceptional 13.8% |
| Russians | 99.6 /100 | #36 | Exceptional 13.9% |
| Lithuanians | 99.6 /100 | #37 | Exceptional 13.9% |
| Immigrants | Moldova | 99.6 /100 | #38 | Exceptional 13.9% |
| Immigrants | Australia | 99.5 /100 | #39 | Exceptional 14.0% |
| Immigrants | Sri Lanka | 99.5 /100 | #40 | Exceptional 14.0% |
| Immigrants | Bolivia | 99.5 /100 | #41 | Exceptional 14.0% |
| Immigrants | Scotland | 99.4 /100 | #42 | Exceptional 14.0% |