Subsaharan African vs Cypriot Single Father Poverty
COMPARE
Subsaharan African
Cypriot
Single Father Poverty
Single Father Poverty Comparison
Sub-Saharan Africans
Cypriots
16.9%
SINGLE FATHER POVERTY
2.9/ 100
METRIC RATING
237th/ 347
METRIC RANK
15.9%
SINGLE FATHER POVERTY
87.5/ 100
METRIC RATING
136th/ 347
METRIC RANK
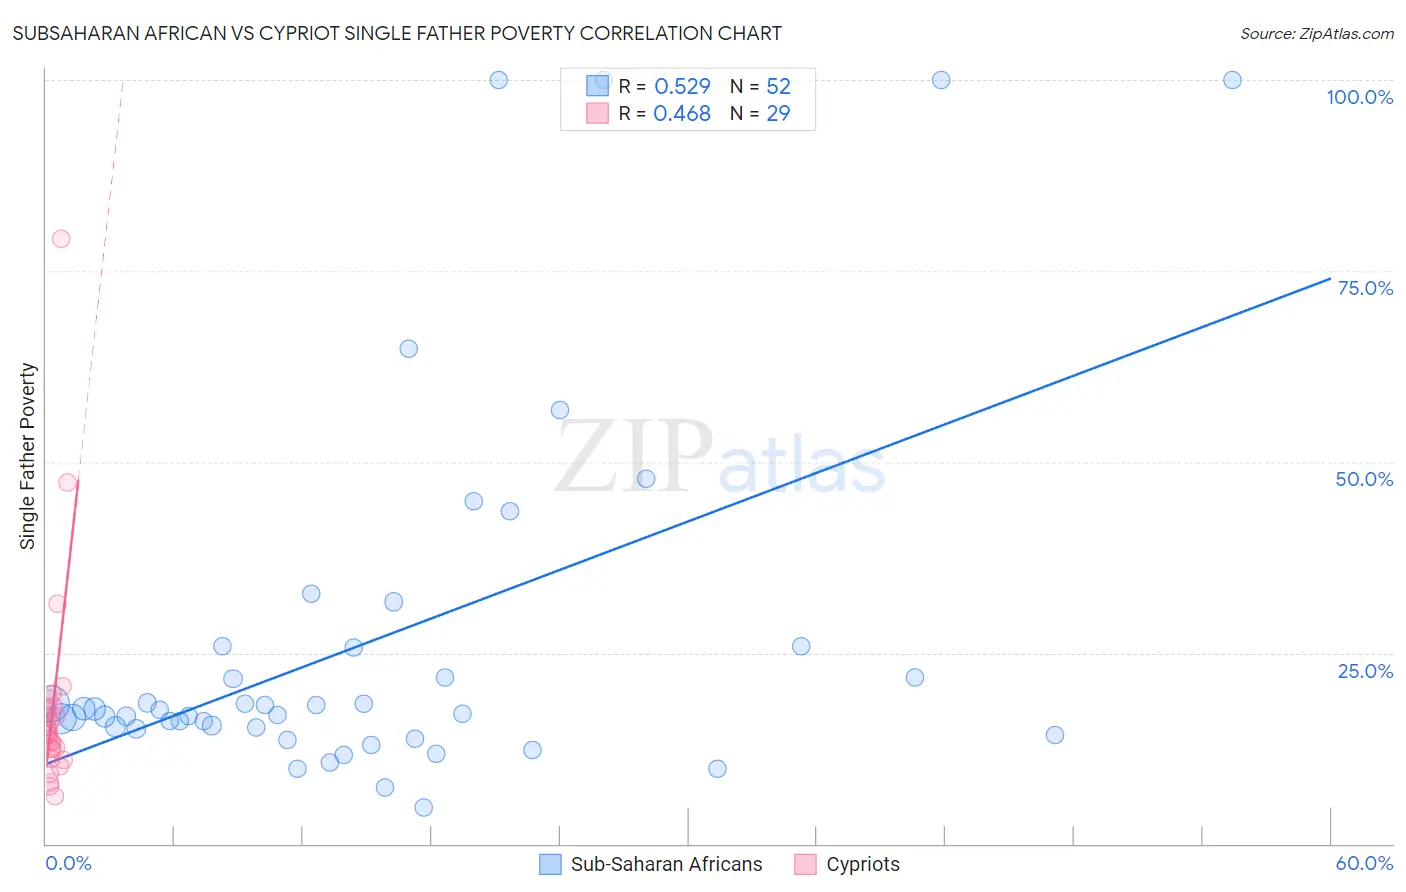
Subsaharan African vs Cypriot Single Father Poverty Correlation Chart
The statistical analysis conducted on geographies consisting of 386,638,837 people shows a substantial positive correlation between the proportion of Sub-Saharan Africans and poverty level among single fathers in the United States with a correlation coefficient (R) of 0.529 and weighted average of 16.9%. Similarly, the statistical analysis conducted on geographies consisting of 55,535,084 people shows a moderate positive correlation between the proportion of Cypriots and poverty level among single fathers in the United States with a correlation coefficient (R) of 0.468 and weighted average of 15.9%, a difference of 6.2%.
Single Father Poverty Correlation Summary
| Measurement | Subsaharan African | Cypriot |
| Minimum | 4.8% | 6.2% |
| Maximum | 100.0% | 79.2% |
| Range | 95.2% | 72.9% |
| Mean | 26.7% | 17.9% |
| Median | 17.3% | 14.6% |
| Interquartile 25% (IQ1) | 15.1% | 11.7% |
| Interquartile 75% (IQ3) | 25.8% | 17.9% |
| Interquartile Range (IQR) | 10.6% | 6.2% |
| Standard Deviation (Sample) | 24.4% | 14.1% |
| Standard Deviation (Population) | 24.1% | 13.9% |
Similar Demographics by Single Father Poverty
Demographics Similar to Sub-Saharan Africans by Single Father Poverty
In terms of single father poverty, the demographic groups most similar to Sub-Saharan Africans are Immigrants from Western Europe (16.9%, a difference of 0.0%), Immigrants from Germany (16.9%, a difference of 0.0%), Immigrants from Saudi Arabia (16.9%, a difference of 0.070%), Bermudan (16.9%, a difference of 0.090%), and Marshallese (16.9%, a difference of 0.10%).
| Demographics | Rating | Rank | Single Father Poverty |
| Immigrants | Trinidad and Tobago | 4.5 /100 | #230 | Tragic 16.8% |
| Spanish Americans | 3.7 /100 | #231 | Tragic 16.9% |
| Immigrants | Grenada | 3.7 /100 | #232 | Tragic 16.9% |
| Senegalese | 3.2 /100 | #233 | Tragic 16.9% |
| Marshallese | 3.1 /100 | #234 | Tragic 16.9% |
| Immigrants | Western Europe | 2.9 /100 | #235 | Tragic 16.9% |
| Immigrants | Germany | 2.9 /100 | #236 | Tragic 16.9% |
| Sub-Saharan Africans | 2.9 /100 | #237 | Tragic 16.9% |
| Immigrants | Saudi Arabia | 2.7 /100 | #238 | Tragic 16.9% |
| Bermudans | 2.6 /100 | #239 | Tragic 16.9% |
| Finns | 2.6 /100 | #240 | Tragic 16.9% |
| Czechs | 2.3 /100 | #241 | Tragic 17.0% |
| Moroccans | 2.1 /100 | #242 | Tragic 17.0% |
| Immigrants | Cabo Verde | 1.6 /100 | #243 | Tragic 17.0% |
| Hondurans | 1.6 /100 | #244 | Tragic 17.0% |
Demographics Similar to Cypriots by Single Father Poverty
In terms of single father poverty, the demographic groups most similar to Cypriots are Immigrants from the Azores (15.9%, a difference of 0.030%), Central American (16.0%, a difference of 0.040%), Immigrants from Sri Lanka (15.9%, a difference of 0.070%), Immigrants from South America (15.9%, a difference of 0.10%), and South American (16.0%, a difference of 0.16%).
| Demographics | Rating | Rank | Single Father Poverty |
| Immigrants | West Indies | 90.8 /100 | #129 | Exceptional 15.9% |
| Norwegians | 90.2 /100 | #130 | Exceptional 15.9% |
| Nicaraguans | 90.1 /100 | #131 | Exceptional 15.9% |
| Immigrants | Portugal | 89.7 /100 | #132 | Excellent 15.9% |
| Immigrants | Syria | 89.5 /100 | #133 | Excellent 15.9% |
| Immigrants | South America | 88.5 /100 | #134 | Excellent 15.9% |
| Immigrants | Sri Lanka | 88.2 /100 | #135 | Excellent 15.9% |
| Cypriots | 87.5 /100 | #136 | Excellent 15.9% |
| Immigrants | Azores | 87.2 /100 | #137 | Excellent 15.9% |
| Central Americans | 87.1 /100 | #138 | Excellent 16.0% |
| South Americans | 85.9 /100 | #139 | Excellent 16.0% |
| Immigrants | Netherlands | 85.3 /100 | #140 | Excellent 16.0% |
| Liberians | 83.3 /100 | #141 | Excellent 16.0% |
| Immigrants | Mexico | 83.3 /100 | #142 | Excellent 16.0% |
| Immigrants | Central America | 83.1 /100 | #143 | Excellent 16.0% |