Subsaharan African vs Immigrants from Pakistan Single Father Poverty
COMPARE
Subsaharan African
Immigrants from Pakistan
Single Father Poverty
Single Father Poverty Comparison
Sub-Saharan Africans
Immigrants from Pakistan
16.9%
SINGLE FATHER POVERTY
2.9/ 100
METRIC RATING
237th/ 347
METRIC RANK
15.0%
SINGLE FATHER POVERTY
99.9/ 100
METRIC RATING
51st/ 347
METRIC RANK
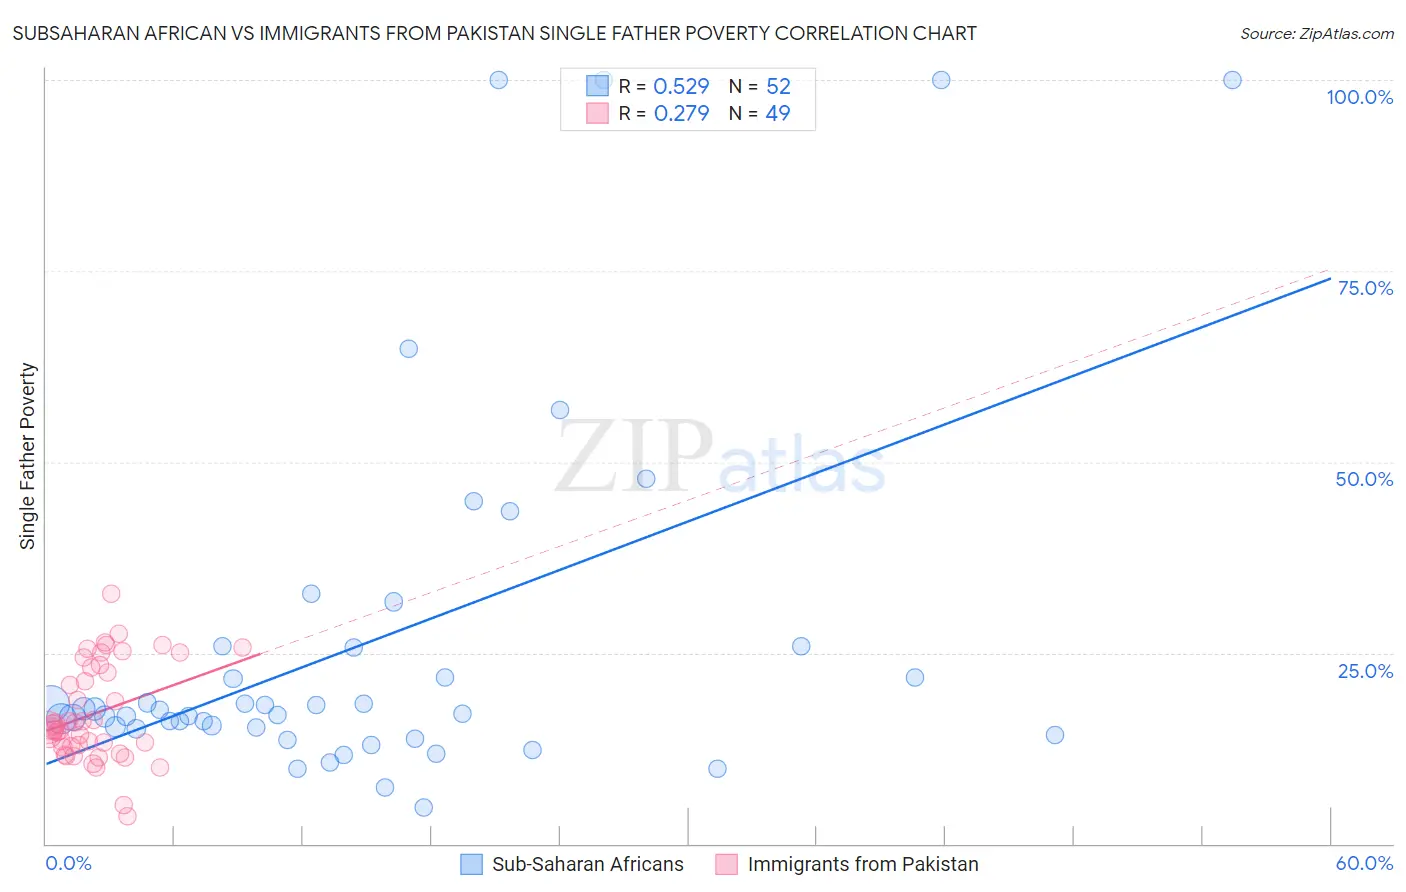
Subsaharan African vs Immigrants from Pakistan Single Father Poverty Correlation Chart
The statistical analysis conducted on geographies consisting of 386,638,837 people shows a substantial positive correlation between the proportion of Sub-Saharan Africans and poverty level among single fathers in the United States with a correlation coefficient (R) of 0.529 and weighted average of 16.9%. Similarly, the statistical analysis conducted on geographies consisting of 230,495,703 people shows a weak positive correlation between the proportion of Immigrants from Pakistan and poverty level among single fathers in the United States with a correlation coefficient (R) of 0.279 and weighted average of 15.0%, a difference of 13.1%.
Single Father Poverty Correlation Summary
| Measurement | Subsaharan African | Immigrants from Pakistan |
| Minimum | 4.8% | 3.7% |
| Maximum | 100.0% | 32.8% |
| Range | 95.2% | 29.1% |
| Mean | 26.7% | 17.1% |
| Median | 17.3% | 15.2% |
| Interquartile 25% (IQ1) | 15.1% | 12.7% |
| Interquartile 75% (IQ3) | 25.8% | 23.2% |
| Interquartile Range (IQR) | 10.6% | 10.5% |
| Standard Deviation (Sample) | 24.4% | 6.4% |
| Standard Deviation (Population) | 24.1% | 6.3% |
Similar Demographics by Single Father Poverty
Demographics Similar to Sub-Saharan Africans by Single Father Poverty
In terms of single father poverty, the demographic groups most similar to Sub-Saharan Africans are Immigrants from Western Europe (16.9%, a difference of 0.0%), Immigrants from Germany (16.9%, a difference of 0.0%), Immigrants from Saudi Arabia (16.9%, a difference of 0.070%), Bermudan (16.9%, a difference of 0.090%), and Marshallese (16.9%, a difference of 0.10%).
| Demographics | Rating | Rank | Single Father Poverty |
| Immigrants | Trinidad and Tobago | 4.5 /100 | #230 | Tragic 16.8% |
| Spanish Americans | 3.7 /100 | #231 | Tragic 16.9% |
| Immigrants | Grenada | 3.7 /100 | #232 | Tragic 16.9% |
| Senegalese | 3.2 /100 | #233 | Tragic 16.9% |
| Marshallese | 3.1 /100 | #234 | Tragic 16.9% |
| Immigrants | Western Europe | 2.9 /100 | #235 | Tragic 16.9% |
| Immigrants | Germany | 2.9 /100 | #236 | Tragic 16.9% |
| Sub-Saharan Africans | 2.9 /100 | #237 | Tragic 16.9% |
| Immigrants | Saudi Arabia | 2.7 /100 | #238 | Tragic 16.9% |
| Bermudans | 2.6 /100 | #239 | Tragic 16.9% |
| Finns | 2.6 /100 | #240 | Tragic 16.9% |
| Czechs | 2.3 /100 | #241 | Tragic 17.0% |
| Moroccans | 2.1 /100 | #242 | Tragic 17.0% |
| Immigrants | Cabo Verde | 1.6 /100 | #243 | Tragic 17.0% |
| Hondurans | 1.6 /100 | #244 | Tragic 17.0% |
Demographics Similar to Immigrants from Pakistan by Single Father Poverty
In terms of single father poverty, the demographic groups most similar to Immigrants from Pakistan are Bhutanese (15.0%, a difference of 0.020%), Immigrants from El Salvador (15.0%, a difference of 0.040%), Immigrants from Eastern Asia (15.0%, a difference of 0.070%), Immigrants from Kenya (15.0%, a difference of 0.070%), and Immigrants from China (14.9%, a difference of 0.23%).
| Demographics | Rating | Rank | Single Father Poverty |
| Salvadorans | 100.0 /100 | #44 | Exceptional 14.9% |
| Immigrants | Somalia | 100.0 /100 | #45 | Exceptional 14.9% |
| Immigrants | Cambodia | 99.9 /100 | #46 | Exceptional 14.9% |
| Immigrants | China | 99.9 /100 | #47 | Exceptional 14.9% |
| Malaysians | 99.9 /100 | #48 | Exceptional 14.9% |
| Immigrants | Eastern Asia | 99.9 /100 | #49 | Exceptional 15.0% |
| Bhutanese | 99.9 /100 | #50 | Exceptional 15.0% |
| Immigrants | Pakistan | 99.9 /100 | #51 | Exceptional 15.0% |
| Immigrants | El Salvador | 99.9 /100 | #52 | Exceptional 15.0% |
| Immigrants | Kenya | 99.9 /100 | #53 | Exceptional 15.0% |
| Immigrants | Uzbekistan | 99.9 /100 | #54 | Exceptional 15.0% |
| Immigrants | Bulgaria | 99.9 /100 | #55 | Exceptional 15.0% |
| Immigrants | Laos | 99.9 /100 | #56 | Exceptional 15.1% |
| Laotians | 99.9 /100 | #57 | Exceptional 15.1% |
| Hawaiians | 99.9 /100 | #58 | Exceptional 15.1% |