Subsaharan African vs Immigrants from Northern Africa Family Poverty
COMPARE
Subsaharan African
Immigrants from Northern Africa
Family Poverty
Family Poverty Comparison
Sub-Saharan Africans
Immigrants from Northern Africa
10.9%
FAMILY POVERTY
0.2/ 100
METRIC RATING
258th/ 347
METRIC RANK
8.8%
FAMILY POVERTY
66.9/ 100
METRIC RATING
161st/ 347
METRIC RANK
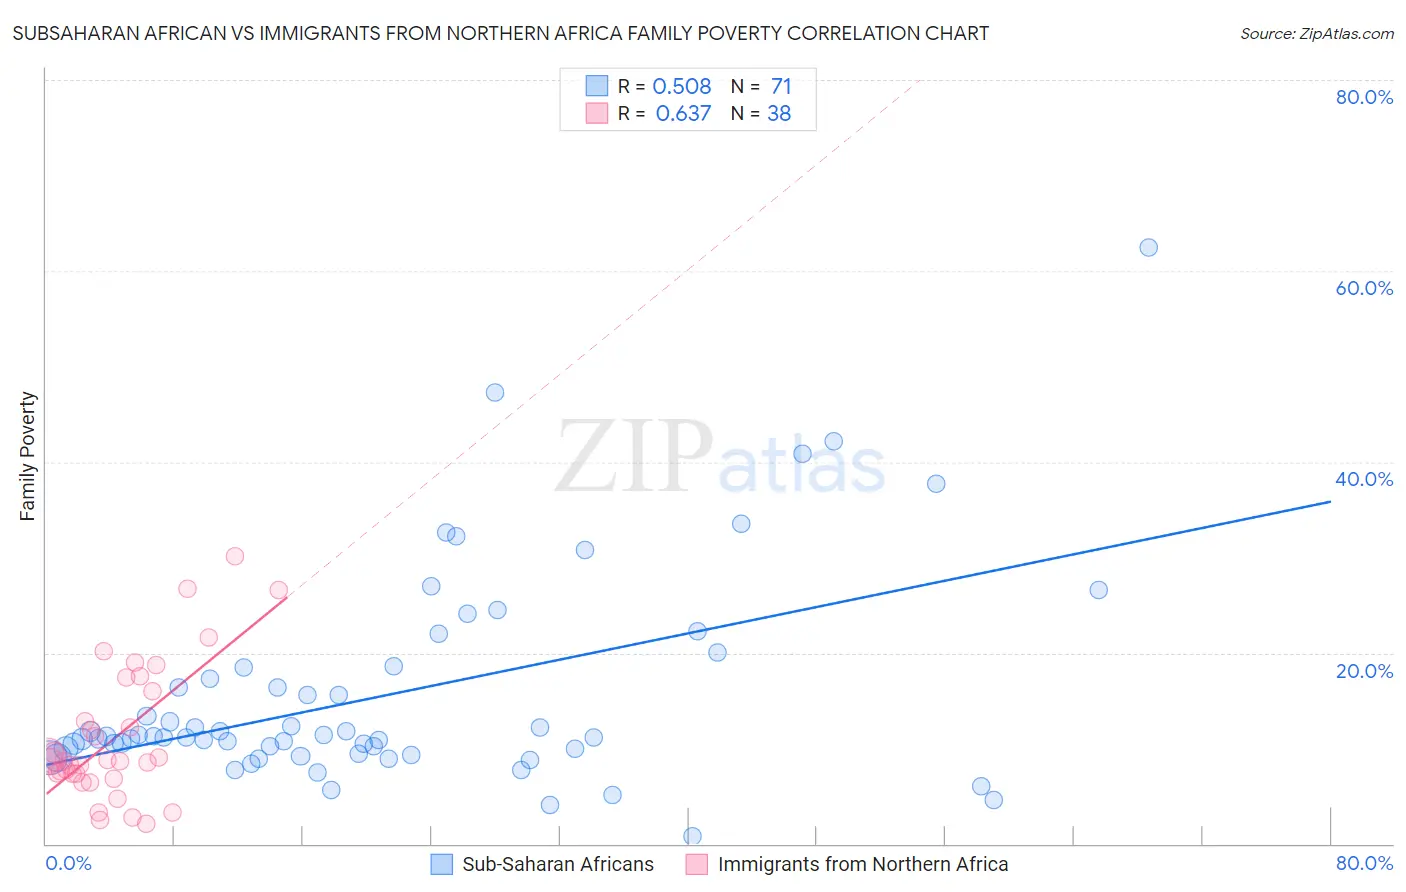
Subsaharan African vs Immigrants from Northern Africa Family Poverty Correlation Chart
The statistical analysis conducted on geographies consisting of 506,098,570 people shows a substantial positive correlation between the proportion of Sub-Saharan Africans and poverty level among families in the United States with a correlation coefficient (R) of 0.508 and weighted average of 10.9%. Similarly, the statistical analysis conducted on geographies consisting of 320,660,985 people shows a significant positive correlation between the proportion of Immigrants from Northern Africa and poverty level among families in the United States with a correlation coefficient (R) of 0.637 and weighted average of 8.8%, a difference of 23.4%.
Family Poverty Correlation Summary
| Measurement | Subsaharan African | Immigrants from Northern Africa |
| Minimum | 0.78% | 2.0% |
| Maximum | 62.5% | 30.2% |
| Range | 61.7% | 28.1% |
| Mean | 15.6% | 11.2% |
| Median | 11.1% | 8.7% |
| Interquartile 25% (IQ1) | 9.4% | 7.3% |
| Interquartile 75% (IQ3) | 18.4% | 16.0% |
| Interquartile Range (IQR) | 9.0% | 8.7% |
| Standard Deviation (Sample) | 11.1% | 7.1% |
| Standard Deviation (Population) | 11.0% | 7.0% |
Similar Demographics by Family Poverty
Demographics Similar to Sub-Saharan Africans by Family Poverty
In terms of family poverty, the demographic groups most similar to Sub-Saharan Africans are Immigrants from Ghana (10.8%, a difference of 0.030%), Mexican American Indian (10.9%, a difference of 0.040%), Chickasaw (10.8%, a difference of 0.070%), Immigrants from Liberia (10.8%, a difference of 0.34%), and Bangladeshi (10.9%, a difference of 0.39%).
| Demographics | Rating | Rank | Family Poverty |
| Iroquois | 0.3 /100 | #251 | Tragic 10.7% |
| Immigrants | Zaire | 0.3 /100 | #252 | Tragic 10.7% |
| Immigrants | Western Africa | 0.3 /100 | #253 | Tragic 10.7% |
| Ecuadorians | 0.2 /100 | #254 | Tragic 10.8% |
| Immigrants | Liberia | 0.2 /100 | #255 | Tragic 10.8% |
| Chickasaw | 0.2 /100 | #256 | Tragic 10.8% |
| Immigrants | Ghana | 0.2 /100 | #257 | Tragic 10.8% |
| Sub-Saharan Africans | 0.2 /100 | #258 | Tragic 10.9% |
| Mexican American Indians | 0.2 /100 | #259 | Tragic 10.9% |
| Bangladeshis | 0.2 /100 | #260 | Tragic 10.9% |
| Shoshone | 0.2 /100 | #261 | Tragic 10.9% |
| Spanish American Indians | 0.2 /100 | #262 | Tragic 10.9% |
| Cape Verdeans | 0.1 /100 | #263 | Tragic 10.9% |
| Trinidadians and Tobagonians | 0.1 /100 | #264 | Tragic 10.9% |
| Immigrants | Trinidad and Tobago | 0.1 /100 | #265 | Tragic 10.9% |
Demographics Similar to Immigrants from Northern Africa by Family Poverty
In terms of family poverty, the demographic groups most similar to Immigrants from Northern Africa are Hungarian (8.8%, a difference of 0.040%), Ethiopian (8.8%, a difference of 0.090%), Pennsylvania German (8.8%, a difference of 0.14%), Peruvian (8.8%, a difference of 0.17%), and Celtic (8.8%, a difference of 0.30%).
| Demographics | Rating | Rank | Family Poverty |
| Immigrants | Vietnam | 75.4 /100 | #154 | Good 8.7% |
| Immigrants | Kuwait | 73.6 /100 | #155 | Good 8.7% |
| Immigrants | Oceania | 71.2 /100 | #156 | Good 8.7% |
| Tsimshian | 69.3 /100 | #157 | Good 8.8% |
| Whites/Caucasians | 69.1 /100 | #158 | Good 8.8% |
| Peruvians | 68.0 /100 | #159 | Good 8.8% |
| Hungarians | 67.2 /100 | #160 | Good 8.8% |
| Immigrants | Northern Africa | 66.9 /100 | #161 | Good 8.8% |
| Ethiopians | 66.3 /100 | #162 | Good 8.8% |
| Pennsylvania Germans | 66.0 /100 | #163 | Good 8.8% |
| Celtics | 64.9 /100 | #164 | Good 8.8% |
| Guamanians/Chamorros | 64.7 /100 | #165 | Good 8.8% |
| Afghans | 63.5 /100 | #166 | Good 8.8% |
| Immigrants | Ethiopia | 62.5 /100 | #167 | Good 8.9% |
| Israelis | 62.1 /100 | #168 | Good 8.9% |