Subsaharan African vs Spanish Family Poverty
COMPARE
Subsaharan African
Spanish
Family Poverty
Family Poverty Comparison
Sub-Saharan Africans
Spanish
10.9%
FAMILY POVERTY
0.2/ 100
METRIC RATING
258th/ 347
METRIC RANK
9.3%
FAMILY POVERTY
28.7/ 100
METRIC RATING
192nd/ 347
METRIC RANK
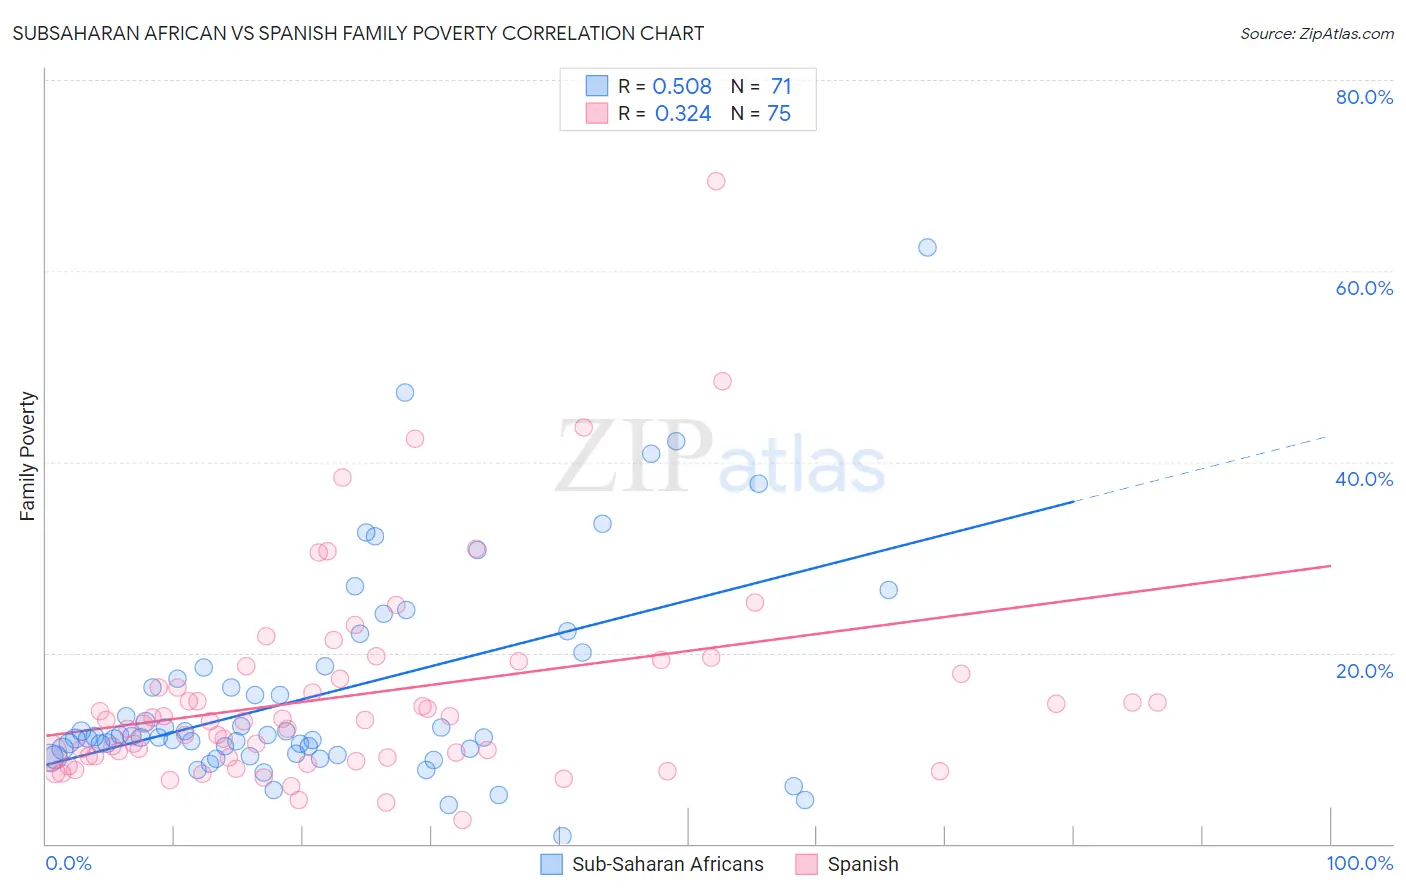
Subsaharan African vs Spanish Family Poverty Correlation Chart
The statistical analysis conducted on geographies consisting of 506,098,570 people shows a substantial positive correlation between the proportion of Sub-Saharan Africans and poverty level among families in the United States with a correlation coefficient (R) of 0.508 and weighted average of 10.9%. Similarly, the statistical analysis conducted on geographies consisting of 421,086,812 people shows a mild positive correlation between the proportion of Spanish and poverty level among families in the United States with a correlation coefficient (R) of 0.324 and weighted average of 9.3%, a difference of 17.0%.
Family Poverty Correlation Summary
| Measurement | Subsaharan African | Spanish |
| Minimum | 0.78% | 2.5% |
| Maximum | 62.5% | 69.4% |
| Range | 61.7% | 66.9% |
| Mean | 15.6% | 15.5% |
| Median | 11.1% | 12.8% |
| Interquartile 25% (IQ1) | 9.4% | 9.0% |
| Interquartile 75% (IQ3) | 18.4% | 17.8% |
| Interquartile Range (IQR) | 9.0% | 8.8% |
| Standard Deviation (Sample) | 11.1% | 11.0% |
| Standard Deviation (Population) | 11.0% | 11.0% |
Similar Demographics by Family Poverty
Demographics Similar to Sub-Saharan Africans by Family Poverty
In terms of family poverty, the demographic groups most similar to Sub-Saharan Africans are Immigrants from Ghana (10.8%, a difference of 0.030%), Mexican American Indian (10.9%, a difference of 0.040%), Chickasaw (10.8%, a difference of 0.070%), Immigrants from Liberia (10.8%, a difference of 0.34%), and Bangladeshi (10.9%, a difference of 0.39%).
| Demographics | Rating | Rank | Family Poverty |
| Iroquois | 0.3 /100 | #251 | Tragic 10.7% |
| Immigrants | Zaire | 0.3 /100 | #252 | Tragic 10.7% |
| Immigrants | Western Africa | 0.3 /100 | #253 | Tragic 10.7% |
| Ecuadorians | 0.2 /100 | #254 | Tragic 10.8% |
| Immigrants | Liberia | 0.2 /100 | #255 | Tragic 10.8% |
| Chickasaw | 0.2 /100 | #256 | Tragic 10.8% |
| Immigrants | Ghana | 0.2 /100 | #257 | Tragic 10.8% |
| Sub-Saharan Africans | 0.2 /100 | #258 | Tragic 10.9% |
| Mexican American Indians | 0.2 /100 | #259 | Tragic 10.9% |
| Bangladeshis | 0.2 /100 | #260 | Tragic 10.9% |
| Shoshone | 0.2 /100 | #261 | Tragic 10.9% |
| Spanish American Indians | 0.2 /100 | #262 | Tragic 10.9% |
| Cape Verdeans | 0.1 /100 | #263 | Tragic 10.9% |
| Trinidadians and Tobagonians | 0.1 /100 | #264 | Tragic 10.9% |
| Immigrants | Trinidad and Tobago | 0.1 /100 | #265 | Tragic 10.9% |
Demographics Similar to Spanish by Family Poverty
In terms of family poverty, the demographic groups most similar to Spanish are Ugandan (9.3%, a difference of 0.010%), Immigrants from Western Asia (9.3%, a difference of 0.070%), South American (9.3%, a difference of 0.090%), Venezuelan (9.3%, a difference of 0.21%), and Arab (9.2%, a difference of 0.42%).
| Demographics | Rating | Rank | Family Poverty |
| Immigrants | Saudi Arabia | 38.6 /100 | #185 | Fair 9.1% |
| Colombians | 36.1 /100 | #186 | Fair 9.2% |
| Delaware | 35.4 /100 | #187 | Fair 9.2% |
| Immigrants | Kenya | 34.0 /100 | #188 | Fair 9.2% |
| Immigrants | Afghanistan | 32.1 /100 | #189 | Fair 9.2% |
| Arabs | 31.5 /100 | #190 | Fair 9.2% |
| Ugandans | 28.7 /100 | #191 | Fair 9.3% |
| Spanish | 28.7 /100 | #192 | Fair 9.3% |
| Immigrants | Western Asia | 28.2 /100 | #193 | Fair 9.3% |
| South Americans | 28.1 /100 | #194 | Fair 9.3% |
| Venezuelans | 27.4 /100 | #195 | Fair 9.3% |
| Immigrants | Venezuela | 26.1 /100 | #196 | Fair 9.3% |
| Immigrants | Colombia | 24.4 /100 | #197 | Fair 9.3% |
| Iraqis | 24.2 /100 | #198 | Fair 9.3% |
| Spaniards | 22.8 /100 | #199 | Fair 9.4% |