Subsaharan African vs Chippewa Householder Income Ages 45 - 64 years
COMPARE
Subsaharan African
Chippewa
Householder Income Ages 45 - 64 years
Householder Income Ages 45 - 64 years Comparison
Sub-Saharan Africans
Chippewa
$90,691
HOUSEHOLDER INCOME AGES 45 - 64 YEARS
0.8/ 100
METRIC RATING
250th/ 347
METRIC RANK
$83,943
HOUSEHOLDER INCOME AGES 45 - 64 YEARS
0.0/ 100
METRIC RATING
305th/ 347
METRIC RANK
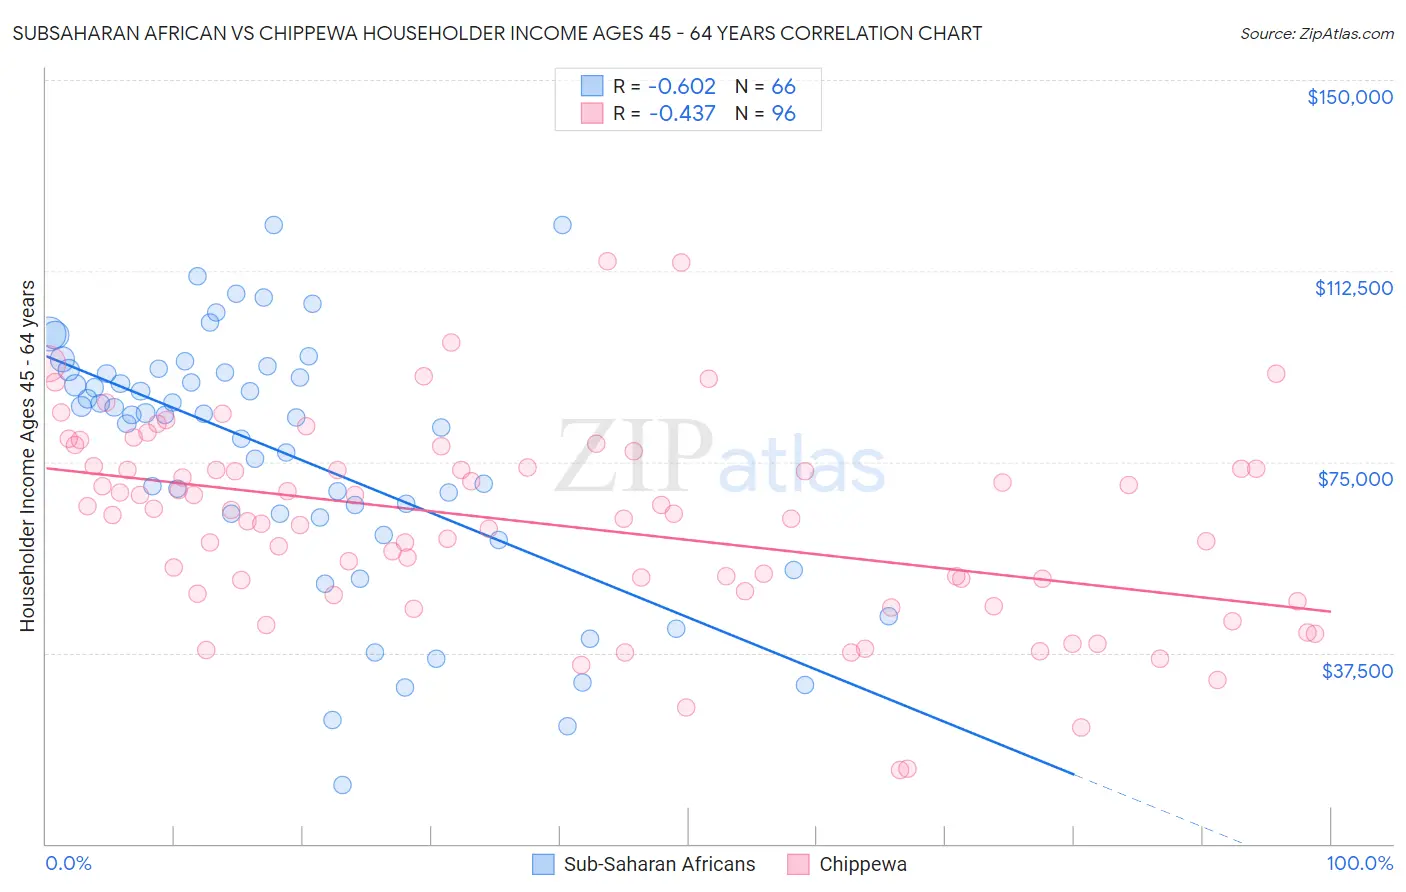
Subsaharan African vs Chippewa Householder Income Ages 45 - 64 years Correlation Chart
The statistical analysis conducted on geographies consisting of 506,198,662 people shows a significant negative correlation between the proportion of Sub-Saharan Africans and household income with householder between the ages 45 and 64 in the United States with a correlation coefficient (R) of -0.602 and weighted average of $90,691. Similarly, the statistical analysis conducted on geographies consisting of 214,822,220 people shows a moderate negative correlation between the proportion of Chippewa and household income with householder between the ages 45 and 64 in the United States with a correlation coefficient (R) of -0.437 and weighted average of $83,943, a difference of 8.0%.
Householder Income Ages 45 - 64 years Correlation Summary
| Measurement | Subsaharan African | Chippewa |
| Minimum | $11,458 | $14,500 |
| Maximum | $121,610 | $114,293 |
| Range | $110,152 | $99,793 |
| Mean | $76,045 | $62,889 |
| Median | $84,198 | $64,689 |
| Interquartile 25% (IQ1) | $64,056 | $49,307 |
| Interquartile 75% (IQ3) | $92,645 | $73,755 |
| Interquartile Range (IQR) | $28,589 | $24,448 |
| Standard Deviation (Sample) | $25,098 | $19,427 |
| Standard Deviation (Population) | $24,907 | $19,326 |
Similar Demographics by Householder Income Ages 45 - 64 years
Demographics Similar to Sub-Saharan Africans by Householder Income Ages 45 - 64 years
In terms of householder income ages 45 - 64 years, the demographic groups most similar to Sub-Saharan Africans are Mexican American Indian ($90,811, a difference of 0.13%), American ($90,536, a difference of 0.17%), Immigrants from Laos ($90,909, a difference of 0.24%), Marshallese ($90,455, a difference of 0.26%), and Central American ($90,951, a difference of 0.29%).
| Demographics | Rating | Rank | Householder Income Ages 45 - 64 years |
| Immigrants | Trinidad and Tobago | 1.1 /100 | #243 | Tragic $91,347 |
| Immigrants | Middle Africa | 1.1 /100 | #244 | Tragic $91,293 |
| Guyanese | 0.9 /100 | #245 | Tragic $90,966 |
| Central Americans | 0.9 /100 | #246 | Tragic $90,951 |
| Alaskan Athabascans | 0.9 /100 | #247 | Tragic $90,951 |
| Immigrants | Laos | 0.9 /100 | #248 | Tragic $90,909 |
| Mexican American Indians | 0.8 /100 | #249 | Tragic $90,811 |
| Sub-Saharan Africans | 0.8 /100 | #250 | Tragic $90,691 |
| Americans | 0.7 /100 | #251 | Tragic $90,536 |
| Marshallese | 0.7 /100 | #252 | Tragic $90,455 |
| Barbadians | 0.6 /100 | #253 | Tragic $90,266 |
| Immigrants | Guyana | 0.6 /100 | #254 | Tragic $90,186 |
| West Indians | 0.5 /100 | #255 | Tragic $89,906 |
| French American Indians | 0.5 /100 | #256 | Tragic $89,811 |
| German Russians | 0.4 /100 | #257 | Tragic $89,398 |
Demographics Similar to Chippewa by Householder Income Ages 45 - 64 years
In terms of householder income ages 45 - 64 years, the demographic groups most similar to Chippewa are Ottawa ($83,953, a difference of 0.010%), Ute ($83,937, a difference of 0.010%), Honduran ($84,079, a difference of 0.16%), Shoshone ($83,588, a difference of 0.43%), and Immigrants from Cabo Verde ($83,542, a difference of 0.48%).
| Demographics | Rating | Rank | Householder Income Ages 45 - 64 years |
| Africans | 0.0 /100 | #298 | Tragic $84,925 |
| Immigrants | Mexico | 0.0 /100 | #299 | Tragic $84,910 |
| Indonesians | 0.0 /100 | #300 | Tragic $84,890 |
| Potawatomi | 0.0 /100 | #301 | Tragic $84,613 |
| Haitians | 0.0 /100 | #302 | Tragic $84,384 |
| Hondurans | 0.0 /100 | #303 | Tragic $84,079 |
| Ottawa | 0.0 /100 | #304 | Tragic $83,953 |
| Chippewa | 0.0 /100 | #305 | Tragic $83,943 |
| Ute | 0.0 /100 | #306 | Tragic $83,937 |
| Shoshone | 0.0 /100 | #307 | Tragic $83,588 |
| Immigrants | Cabo Verde | 0.0 /100 | #308 | Tragic $83,542 |
| Immigrants | Dominica | 0.0 /100 | #309 | Tragic $83,311 |
| Immigrants | Haiti | 0.0 /100 | #310 | Tragic $83,257 |
| Immigrants | Bahamas | 0.0 /100 | #311 | Tragic $83,177 |
| Cajuns | 0.0 /100 | #312 | Tragic $83,015 |