Subsaharan African vs Chippewa Unemployment Among Seniors over 75 years
COMPARE
Subsaharan African
Chippewa
Unemployment Among Seniors over 75 years
Unemployment Among Seniors over 75 years Comparison
Sub-Saharan Africans
Chippewa
9.2%
UNEMPLOYMENT AMONG SENIORS OVER 75 YEARS
2.3/ 100
METRIC RATING
247th/ 347
METRIC RANK
10.1%
UNEMPLOYMENT AMONG SENIORS OVER 75 YEARS
0.0/ 100
METRIC RATING
312th/ 347
METRIC RANK
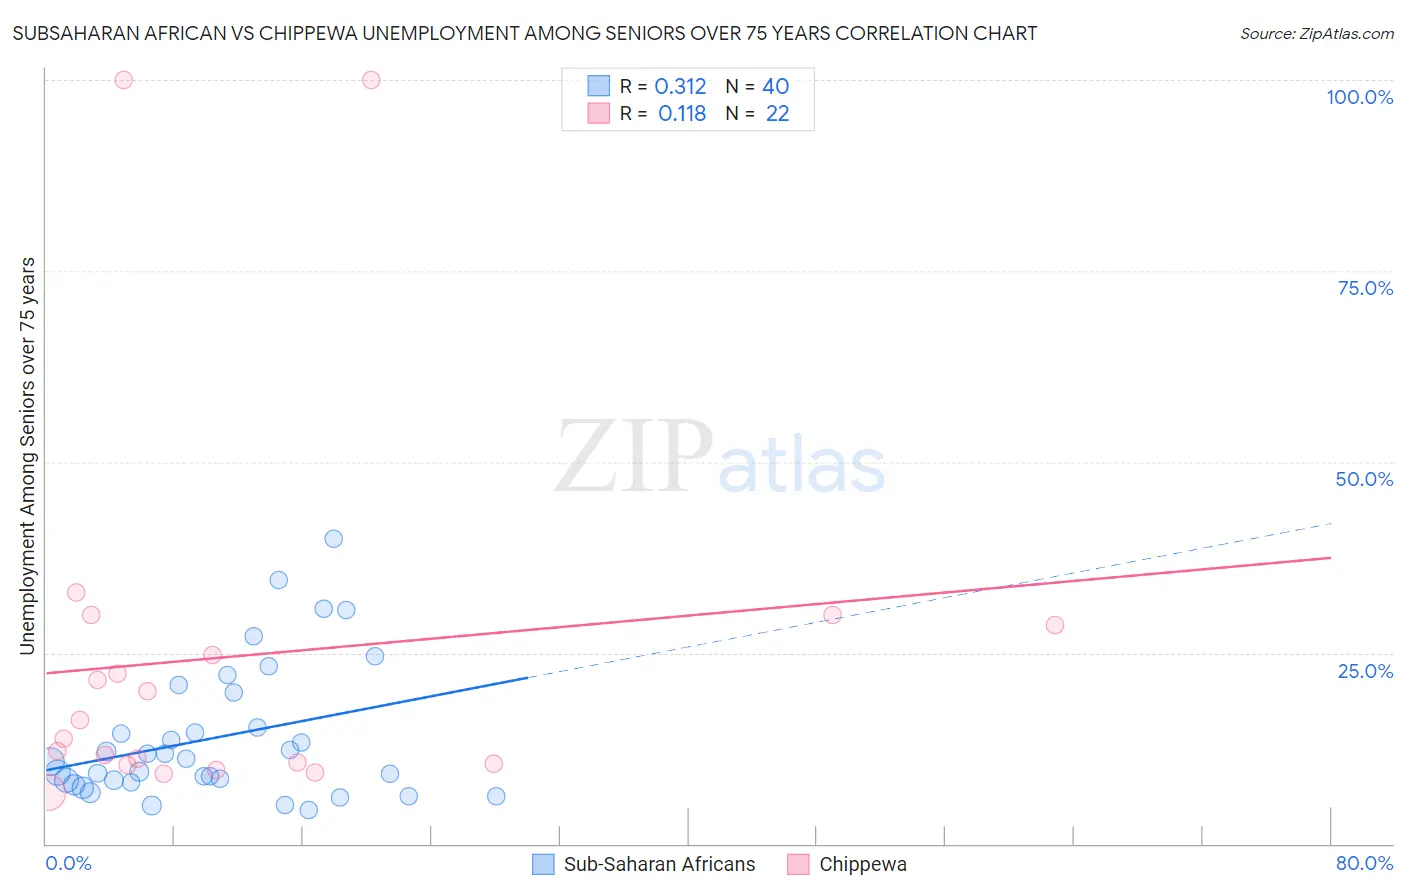
Subsaharan African vs Chippewa Unemployment Among Seniors over 75 years Correlation Chart
The statistical analysis conducted on geographies consisting of 227,990,978 people shows a mild positive correlation between the proportion of Sub-Saharan Africans and unemployment rate among seniors over the age of 75 in the United States with a correlation coefficient (R) of 0.312 and weighted average of 9.2%. Similarly, the statistical analysis conducted on geographies consisting of 127,025,667 people shows a poor positive correlation between the proportion of Chippewa and unemployment rate among seniors over the age of 75 in the United States with a correlation coefficient (R) of 0.118 and weighted average of 10.1%, a difference of 10.0%.
Unemployment Among Seniors over 75 years Correlation Summary
| Measurement | Subsaharan African | Chippewa |
| Minimum | 4.4% | 6.8% |
| Maximum | 40.0% | 100.0% |
| Range | 35.6% | 93.2% |
| Mean | 13.9% | 24.6% |
| Median | 10.9% | 15.0% |
| Interquartile 25% (IQ1) | 8.2% | 10.5% |
| Interquartile 75% (IQ3) | 17.5% | 28.6% |
| Interquartile Range (IQR) | 9.4% | 18.1% |
| Standard Deviation (Sample) | 8.8% | 25.7% |
| Standard Deviation (Population) | 8.7% | 25.1% |
Similar Demographics by Unemployment Among Seniors over 75 years
Demographics Similar to Sub-Saharan Africans by Unemployment Among Seniors over 75 years
In terms of unemployment among seniors over 75 years, the demographic groups most similar to Sub-Saharan Africans are Immigrants from North America (9.2%, a difference of 0.020%), Blackfeet (9.2%, a difference of 0.040%), Immigrants from Saudi Arabia (9.2%, a difference of 0.090%), Central American Indian (9.2%, a difference of 0.10%), and Immigrants from Canada (9.2%, a difference of 0.14%).
| Demographics | Rating | Rank | Unemployment Among Seniors over 75 years |
| Spanish | 3.3 /100 | #240 | Tragic 9.1% |
| Immigrants | Southern Europe | 2.8 /100 | #241 | Tragic 9.2% |
| Sierra Leoneans | 2.8 /100 | #242 | Tragic 9.2% |
| Slavs | 2.8 /100 | #243 | Tragic 9.2% |
| Immigrants | Germany | 2.7 /100 | #244 | Tragic 9.2% |
| Immigrants | Canada | 2.6 /100 | #245 | Tragic 9.2% |
| Immigrants | North America | 2.4 /100 | #246 | Tragic 9.2% |
| Sub-Saharan Africans | 2.3 /100 | #247 | Tragic 9.2% |
| Blackfeet | 2.3 /100 | #248 | Tragic 9.2% |
| Immigrants | Saudi Arabia | 2.2 /100 | #249 | Tragic 9.2% |
| Central American Indians | 2.2 /100 | #250 | Tragic 9.2% |
| Immigrants | Poland | 2.0 /100 | #251 | Tragic 9.2% |
| Immigrants | Sudan | 2.0 /100 | #252 | Tragic 9.2% |
| Pima | 1.8 /100 | #253 | Tragic 9.2% |
| Immigrants | Ghana | 1.7 /100 | #254 | Tragic 9.2% |
Demographics Similar to Chippewa by Unemployment Among Seniors over 75 years
In terms of unemployment among seniors over 75 years, the demographic groups most similar to Chippewa are Scottish (10.1%, a difference of 0.010%), Nepalese (10.1%, a difference of 0.12%), Hungarian (10.1%, a difference of 0.13%), English (10.1%, a difference of 0.31%), and White/Caucasian (10.1%, a difference of 0.38%).
| Demographics | Rating | Rank | Unemployment Among Seniors over 75 years |
| Swedes | 0.0 /100 | #305 | Tragic 10.0% |
| Italians | 0.0 /100 | #306 | Tragic 10.0% |
| Immigrants | Fiji | 0.0 /100 | #307 | Tragic 10.0% |
| Whites/Caucasians | 0.0 /100 | #308 | Tragic 10.1% |
| English | 0.0 /100 | #309 | Tragic 10.1% |
| Hungarians | 0.0 /100 | #310 | Tragic 10.1% |
| Scottish | 0.0 /100 | #311 | Tragic 10.1% |
| Chippewa | 0.0 /100 | #312 | Tragic 10.1% |
| Nepalese | 0.0 /100 | #313 | Tragic 10.1% |
| Dutch West Indians | 0.0 /100 | #314 | Tragic 10.2% |
| Pennsylvania Germans | 0.0 /100 | #315 | Tragic 10.2% |
| Natives/Alaskans | 0.0 /100 | #316 | Tragic 10.2% |
| Irish | 0.0 /100 | #317 | Tragic 10.2% |
| Liberians | 0.0 /100 | #318 | Tragic 10.2% |
| Germans | 0.0 /100 | #319 | Tragic 10.3% |