Immigrants from Sudan vs Black/African American Seniors Poverty Over the Age of 75
COMPARE
Immigrants from Sudan
Black/African American
Seniors Poverty Over the Age of 75
Seniors Poverty Over the Age of 75 Comparison
Immigrants from Sudan
Blacks/African Americans
12.1%
SENIORS POVERTY OVER THE AGE OF 75
61.7/ 100
METRIC RATING
157th/ 347
METRIC RANK
14.6%
SENIORS POVERTY OVER THE AGE OF 75
0.0/ 100
METRIC RATING
279th/ 347
METRIC RANK
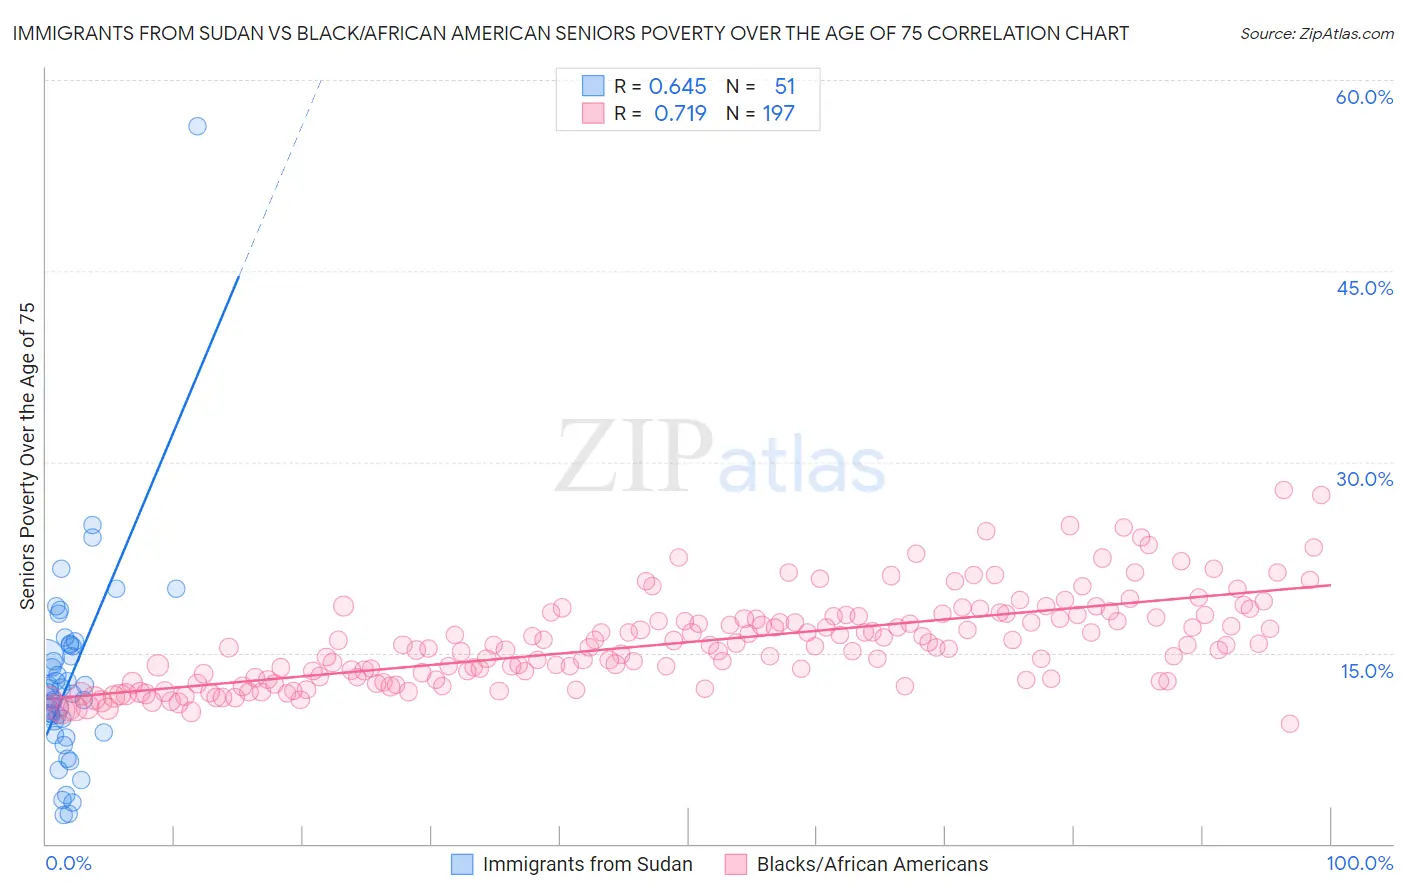
Immigrants from Sudan vs Black/African American Seniors Poverty Over the Age of 75 Correlation Chart
The statistical analysis conducted on geographies consisting of 118,554,808 people shows a significant positive correlation between the proportion of Immigrants from Sudan and poverty level among seniors over the age of 75 in the United States with a correlation coefficient (R) of 0.645 and weighted average of 12.1%. Similarly, the statistical analysis conducted on geographies consisting of 551,157,628 people shows a strong positive correlation between the proportion of Blacks/African Americans and poverty level among seniors over the age of 75 in the United States with a correlation coefficient (R) of 0.719 and weighted average of 14.6%, a difference of 21.3%.
Seniors Poverty Over the Age of 75 Correlation Summary
| Measurement | Immigrants from Sudan | Black/African American |
| Minimum | 2.2% | 9.4% |
| Maximum | 56.4% | 27.7% |
| Range | 54.2% | 18.3% |
| Mean | 12.9% | 15.8% |
| Median | 11.8% | 15.4% |
| Interquartile 25% (IQ1) | 8.7% | 12.9% |
| Interquartile 75% (IQ3) | 15.6% | 17.8% |
| Interquartile Range (IQR) | 6.9% | 4.9% |
| Standard Deviation (Sample) | 8.2% | 3.5% |
| Standard Deviation (Population) | 8.1% | 3.5% |
Similar Demographics by Seniors Poverty Over the Age of 75
Demographics Similar to Immigrants from Sudan by Seniors Poverty Over the Age of 75
In terms of seniors poverty over the age of 75, the demographic groups most similar to Immigrants from Sudan are Portuguese (12.1%, a difference of 0.040%), Immigrants from Middle Africa (12.1%, a difference of 0.040%), Immigrants from Burma/Myanmar (12.1%, a difference of 0.060%), Immigrants from Eastern Africa (12.1%, a difference of 0.070%), and Indonesian (12.1%, a difference of 0.080%).
| Demographics | Rating | Rank | Seniors Poverty Over the Age of 75 |
| Cypriots | 67.3 /100 | #150 | Good 12.0% |
| Cherokee | 65.8 /100 | #151 | Good 12.0% |
| Immigrants | Korea | 65.5 /100 | #152 | Good 12.0% |
| Immigrants | Turkey | 64.7 /100 | #153 | Good 12.0% |
| Cambodians | 64.0 /100 | #154 | Good 12.0% |
| Indonesians | 62.6 /100 | #155 | Good 12.1% |
| Immigrants | Burma/Myanmar | 62.3 /100 | #156 | Good 12.1% |
| Immigrants | Sudan | 61.7 /100 | #157 | Good 12.1% |
| Portuguese | 61.3 /100 | #158 | Good 12.1% |
| Immigrants | Middle Africa | 61.2 /100 | #159 | Good 12.1% |
| Immigrants | Eastern Africa | 60.9 /100 | #160 | Good 12.1% |
| Immigrants | Norway | 60.6 /100 | #161 | Good 12.1% |
| Immigrants | Serbia | 60.2 /100 | #162 | Good 12.1% |
| Immigrants | Greece | 58.2 /100 | #163 | Average 12.1% |
| Potawatomi | 57.4 /100 | #164 | Average 12.1% |
Demographics Similar to Blacks/African Americans by Seniors Poverty Over the Age of 75
In terms of seniors poverty over the age of 75, the demographic groups most similar to Blacks/African Americans are Immigrants from Colombia (14.6%, a difference of 0.21%), Central American (14.7%, a difference of 0.64%), Belizean (14.8%, a difference of 0.76%), Immigrants from Senegal (14.8%, a difference of 0.93%), and Senegalese (14.5%, a difference of 0.99%).
| Demographics | Rating | Rank | Seniors Poverty Over the Age of 75 |
| Mexicans | 0.0 /100 | #272 | Tragic 14.4% |
| Immigrants | South America | 0.0 /100 | #273 | Tragic 14.4% |
| Immigrants | Bahamas | 0.0 /100 | #274 | Tragic 14.4% |
| Immigrants | El Salvador | 0.0 /100 | #275 | Tragic 14.5% |
| Soviet Union | 0.0 /100 | #276 | Tragic 14.5% |
| Senegalese | 0.0 /100 | #277 | Tragic 14.5% |
| Immigrants | Colombia | 0.0 /100 | #278 | Tragic 14.6% |
| Blacks/African Americans | 0.0 /100 | #279 | Tragic 14.6% |
| Central Americans | 0.0 /100 | #280 | Tragic 14.7% |
| Belizeans | 0.0 /100 | #281 | Tragic 14.8% |
| Immigrants | Senegal | 0.0 /100 | #282 | Tragic 14.8% |
| Guatemalans | 0.0 /100 | #283 | Tragic 14.8% |
| Cheyenne | 0.0 /100 | #284 | Tragic 14.9% |
| Immigrants | Mexico | 0.0 /100 | #285 | Tragic 14.9% |
| Immigrants | Central America | 0.0 /100 | #286 | Tragic 15.0% |