Tlingit-Haida vs Black/African American Seniors Poverty Over the Age of 75
COMPARE
Tlingit-Haida
Black/African American
Seniors Poverty Over the Age of 75
Seniors Poverty Over the Age of 75 Comparison
Tlingit-Haida
Blacks/African Americans
9.7%
SENIORS POVERTY OVER THE AGE OF 75
100.0/ 100
METRIC RATING
2nd/ 347
METRIC RANK
14.6%
SENIORS POVERTY OVER THE AGE OF 75
0.0/ 100
METRIC RATING
279th/ 347
METRIC RANK
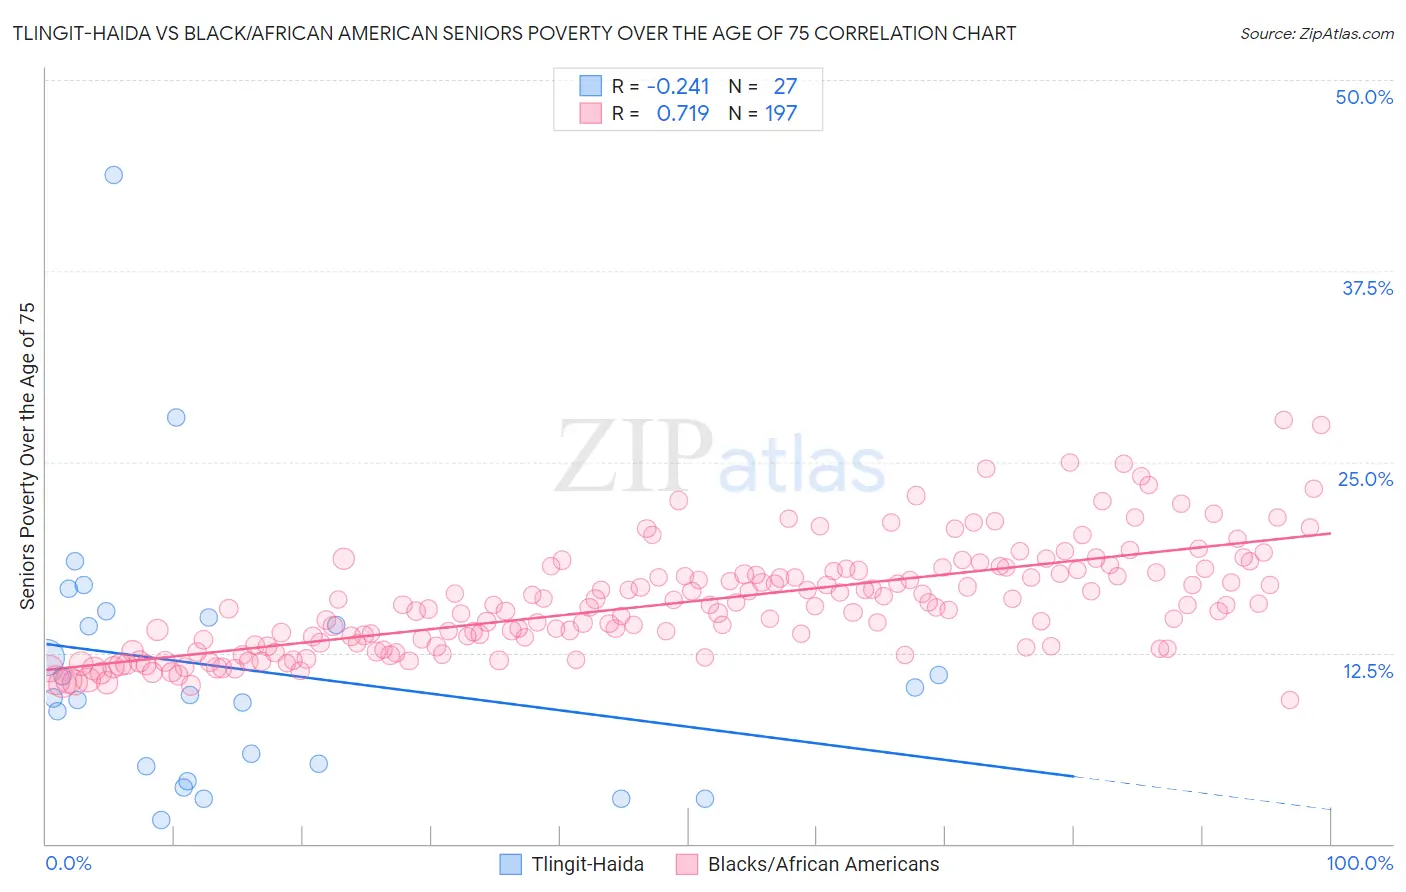
Tlingit-Haida vs Black/African American Seniors Poverty Over the Age of 75 Correlation Chart
The statistical analysis conducted on geographies consisting of 60,526,405 people shows a weak negative correlation between the proportion of Tlingit-Haida and poverty level among seniors over the age of 75 in the United States with a correlation coefficient (R) of -0.241 and weighted average of 9.7%. Similarly, the statistical analysis conducted on geographies consisting of 551,157,628 people shows a strong positive correlation between the proportion of Blacks/African Americans and poverty level among seniors over the age of 75 in the United States with a correlation coefficient (R) of 0.719 and weighted average of 14.6%, a difference of 51.0%.
Seniors Poverty Over the Age of 75 Correlation Summary
| Measurement | Tlingit-Haida | Black/African American |
| Minimum | 1.5% | 9.4% |
| Maximum | 43.8% | 27.7% |
| Range | 42.2% | 18.3% |
| Mean | 11.4% | 15.8% |
| Median | 9.7% | 15.4% |
| Interquartile 25% (IQ1) | 5.0% | 12.9% |
| Interquartile 75% (IQ3) | 14.8% | 17.8% |
| Interquartile Range (IQR) | 9.8% | 4.9% |
| Standard Deviation (Sample) | 8.8% | 3.5% |
| Standard Deviation (Population) | 8.7% | 3.5% |
Similar Demographics by Seniors Poverty Over the Age of 75
Demographics Similar to Tlingit-Haida by Seniors Poverty Over the Age of 75
In terms of seniors poverty over the age of 75, the demographic groups most similar to Tlingit-Haida are Native Hawaiian (10.1%, a difference of 3.8%), Swedish (10.2%, a difference of 4.7%), Norwegian (10.2%, a difference of 5.1%), Danish (10.2%, a difference of 5.4%), and Maltese (10.3%, a difference of 6.1%).
| Demographics | Rating | Rank | Seniors Poverty Over the Age of 75 |
| Chinese | 100.0 /100 | #1 | Exceptional 9.1% |
| Tlingit-Haida | 100.0 /100 | #2 | Exceptional 9.7% |
| Native Hawaiians | 100.0 /100 | #3 | Exceptional 10.1% |
| Swedes | 100.0 /100 | #4 | Exceptional 10.2% |
| Norwegians | 100.0 /100 | #5 | Exceptional 10.2% |
| Danes | 100.0 /100 | #6 | Exceptional 10.2% |
| Maltese | 100.0 /100 | #7 | Exceptional 10.3% |
| Germans | 99.9 /100 | #8 | Exceptional 10.4% |
| English | 99.9 /100 | #9 | Exceptional 10.4% |
| Scandinavians | 99.9 /100 | #10 | Exceptional 10.4% |
| Immigrants | India | 99.9 /100 | #11 | Exceptional 10.4% |
| Tongans | 99.9 /100 | #12 | Exceptional 10.5% |
| Croatians | 99.9 /100 | #13 | Exceptional 10.5% |
| Scottish | 99.9 /100 | #14 | Exceptional 10.5% |
| Europeans | 99.9 /100 | #15 | Exceptional 10.5% |
Demographics Similar to Blacks/African Americans by Seniors Poverty Over the Age of 75
In terms of seniors poverty over the age of 75, the demographic groups most similar to Blacks/African Americans are Immigrants from Colombia (14.6%, a difference of 0.21%), Central American (14.7%, a difference of 0.64%), Belizean (14.8%, a difference of 0.76%), Immigrants from Senegal (14.8%, a difference of 0.93%), and Senegalese (14.5%, a difference of 0.99%).
| Demographics | Rating | Rank | Seniors Poverty Over the Age of 75 |
| Mexicans | 0.0 /100 | #272 | Tragic 14.4% |
| Immigrants | South America | 0.0 /100 | #273 | Tragic 14.4% |
| Immigrants | Bahamas | 0.0 /100 | #274 | Tragic 14.4% |
| Immigrants | El Salvador | 0.0 /100 | #275 | Tragic 14.5% |
| Soviet Union | 0.0 /100 | #276 | Tragic 14.5% |
| Senegalese | 0.0 /100 | #277 | Tragic 14.5% |
| Immigrants | Colombia | 0.0 /100 | #278 | Tragic 14.6% |
| Blacks/African Americans | 0.0 /100 | #279 | Tragic 14.6% |
| Central Americans | 0.0 /100 | #280 | Tragic 14.7% |
| Belizeans | 0.0 /100 | #281 | Tragic 14.8% |
| Immigrants | Senegal | 0.0 /100 | #282 | Tragic 14.8% |
| Guatemalans | 0.0 /100 | #283 | Tragic 14.8% |
| Cheyenne | 0.0 /100 | #284 | Tragic 14.9% |
| Immigrants | Mexico | 0.0 /100 | #285 | Tragic 14.9% |
| Immigrants | Central America | 0.0 /100 | #286 | Tragic 15.0% |