Sudanese vs Black/African American Seniors Poverty Over the Age of 75
COMPARE
Sudanese
Black/African American
Seniors Poverty Over the Age of 75
Seniors Poverty Over the Age of 75 Comparison
Sudanese
Blacks/African Americans
11.8%
SENIORS POVERTY OVER THE AGE OF 75
83.6/ 100
METRIC RATING
125th/ 347
METRIC RANK
14.6%
SENIORS POVERTY OVER THE AGE OF 75
0.0/ 100
METRIC RATING
279th/ 347
METRIC RANK
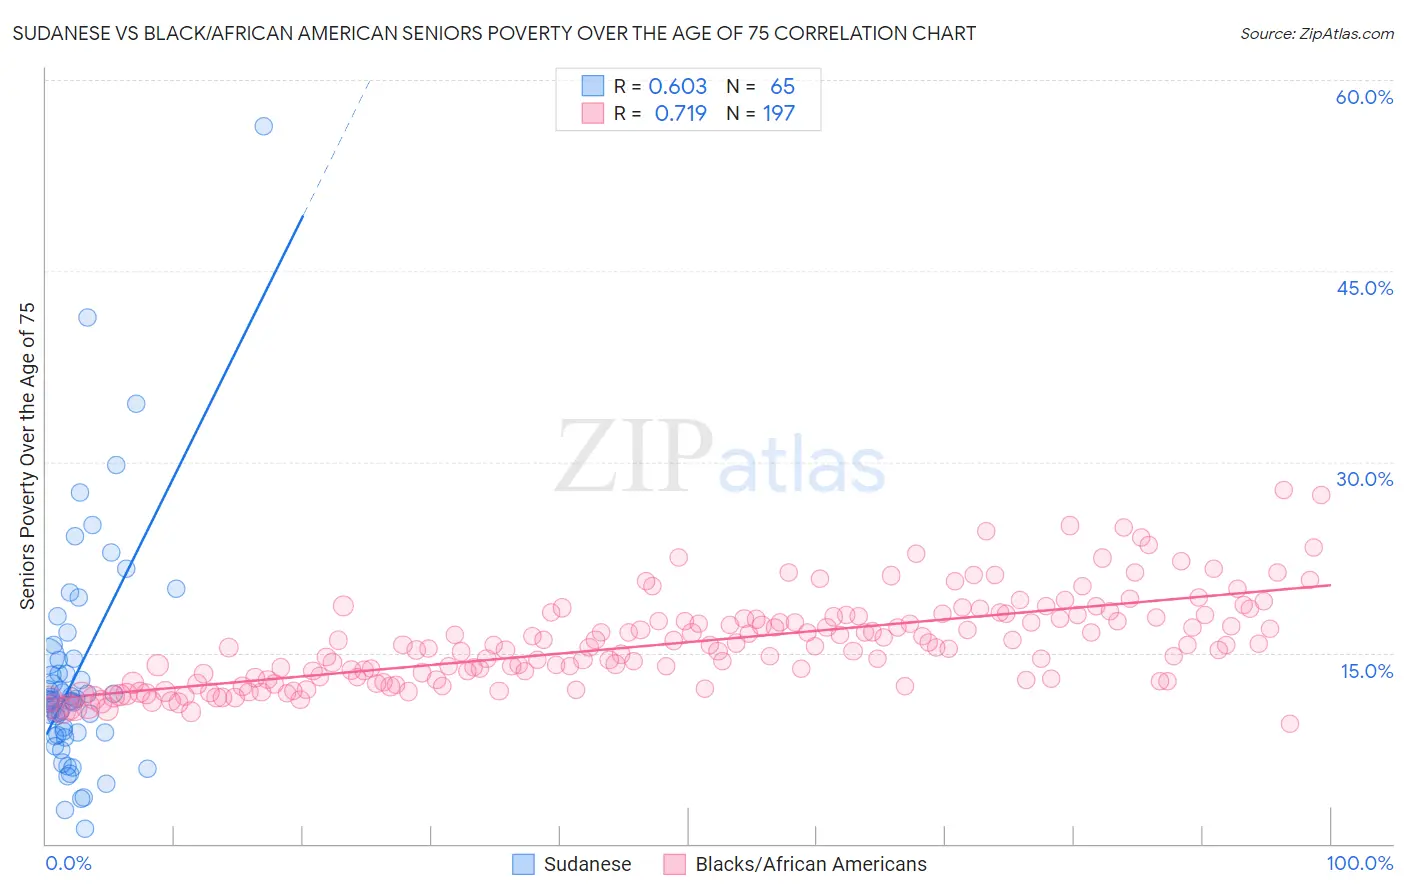
Sudanese vs Black/African American Seniors Poverty Over the Age of 75 Correlation Chart
The statistical analysis conducted on geographies consisting of 109,744,801 people shows a significant positive correlation between the proportion of Sudanese and poverty level among seniors over the age of 75 in the United States with a correlation coefficient (R) of 0.603 and weighted average of 11.8%. Similarly, the statistical analysis conducted on geographies consisting of 551,157,628 people shows a strong positive correlation between the proportion of Blacks/African Americans and poverty level among seniors over the age of 75 in the United States with a correlation coefficient (R) of 0.719 and weighted average of 14.6%, a difference of 24.3%.
Seniors Poverty Over the Age of 75 Correlation Summary
| Measurement | Sudanese | Black/African American |
| Minimum | 1.2% | 9.4% |
| Maximum | 56.4% | 27.7% |
| Range | 55.2% | 18.3% |
| Mean | 13.4% | 15.8% |
| Median | 11.3% | 15.4% |
| Interquartile 25% (IQ1) | 8.6% | 12.9% |
| Interquartile 75% (IQ3) | 14.6% | 17.8% |
| Interquartile Range (IQR) | 6.0% | 4.9% |
| Standard Deviation (Sample) | 9.1% | 3.5% |
| Standard Deviation (Population) | 9.1% | 3.5% |
Similar Demographics by Seniors Poverty Over the Age of 75
Demographics Similar to Sudanese by Seniors Poverty Over the Age of 75
In terms of seniors poverty over the age of 75, the demographic groups most similar to Sudanese are Fijian (11.8%, a difference of 0.030%), Pennsylvania German (11.8%, a difference of 0.040%), Pakistani (11.8%, a difference of 0.060%), Immigrants from Italy (11.8%, a difference of 0.060%), and Malaysian (11.8%, a difference of 0.070%).
| Demographics | Rating | Rank | Seniors Poverty Over the Age of 75 |
| Immigrants | Zimbabwe | 85.5 /100 | #118 | Excellent 11.7% |
| Immigrants | Uganda | 84.8 /100 | #119 | Excellent 11.8% |
| Immigrants | Nepal | 84.5 /100 | #120 | Excellent 11.8% |
| Malaysians | 84.1 /100 | #121 | Excellent 11.8% |
| Pakistanis | 84.0 /100 | #122 | Excellent 11.8% |
| Immigrants | Italy | 84.0 /100 | #123 | Excellent 11.8% |
| Fijians | 83.8 /100 | #124 | Excellent 11.8% |
| Sudanese | 83.6 /100 | #125 | Excellent 11.8% |
| Pennsylvania Germans | 83.4 /100 | #126 | Excellent 11.8% |
| Immigrants | Denmark | 82.6 /100 | #127 | Excellent 11.8% |
| Immigrants | Hungary | 81.7 /100 | #128 | Excellent 11.8% |
| Ethiopians | 80.7 /100 | #129 | Excellent 11.8% |
| Spanish | 80.5 /100 | #130 | Excellent 11.8% |
| Immigrants | Western Europe | 79.6 /100 | #131 | Good 11.9% |
| Lebanese | 78.3 /100 | #132 | Good 11.9% |
Demographics Similar to Blacks/African Americans by Seniors Poverty Over the Age of 75
In terms of seniors poverty over the age of 75, the demographic groups most similar to Blacks/African Americans are Immigrants from Colombia (14.6%, a difference of 0.21%), Central American (14.7%, a difference of 0.64%), Belizean (14.8%, a difference of 0.76%), Immigrants from Senegal (14.8%, a difference of 0.93%), and Senegalese (14.5%, a difference of 0.99%).
| Demographics | Rating | Rank | Seniors Poverty Over the Age of 75 |
| Mexicans | 0.0 /100 | #272 | Tragic 14.4% |
| Immigrants | South America | 0.0 /100 | #273 | Tragic 14.4% |
| Immigrants | Bahamas | 0.0 /100 | #274 | Tragic 14.4% |
| Immigrants | El Salvador | 0.0 /100 | #275 | Tragic 14.5% |
| Soviet Union | 0.0 /100 | #276 | Tragic 14.5% |
| Senegalese | 0.0 /100 | #277 | Tragic 14.5% |
| Immigrants | Colombia | 0.0 /100 | #278 | Tragic 14.6% |
| Blacks/African Americans | 0.0 /100 | #279 | Tragic 14.6% |
| Central Americans | 0.0 /100 | #280 | Tragic 14.7% |
| Belizeans | 0.0 /100 | #281 | Tragic 14.8% |
| Immigrants | Senegal | 0.0 /100 | #282 | Tragic 14.8% |
| Guatemalans | 0.0 /100 | #283 | Tragic 14.8% |
| Cheyenne | 0.0 /100 | #284 | Tragic 14.9% |
| Immigrants | Mexico | 0.0 /100 | #285 | Tragic 14.9% |
| Immigrants | Central America | 0.0 /100 | #286 | Tragic 15.0% |