Spanish American vs Cherokee Householder Income Ages 45 - 64 years
COMPARE
Spanish American
Cherokee
Householder Income Ages 45 - 64 years
Householder Income Ages 45 - 64 years Comparison
Spanish Americans
Cherokee
$87,836
HOUSEHOLDER INCOME AGES 45 - 64 YEARS
0.2/ 100
METRIC RATING
269th/ 347
METRIC RANK
$86,125
HOUSEHOLDER INCOME AGES 45 - 64 YEARS
0.1/ 100
METRIC RATING
290th/ 347
METRIC RANK
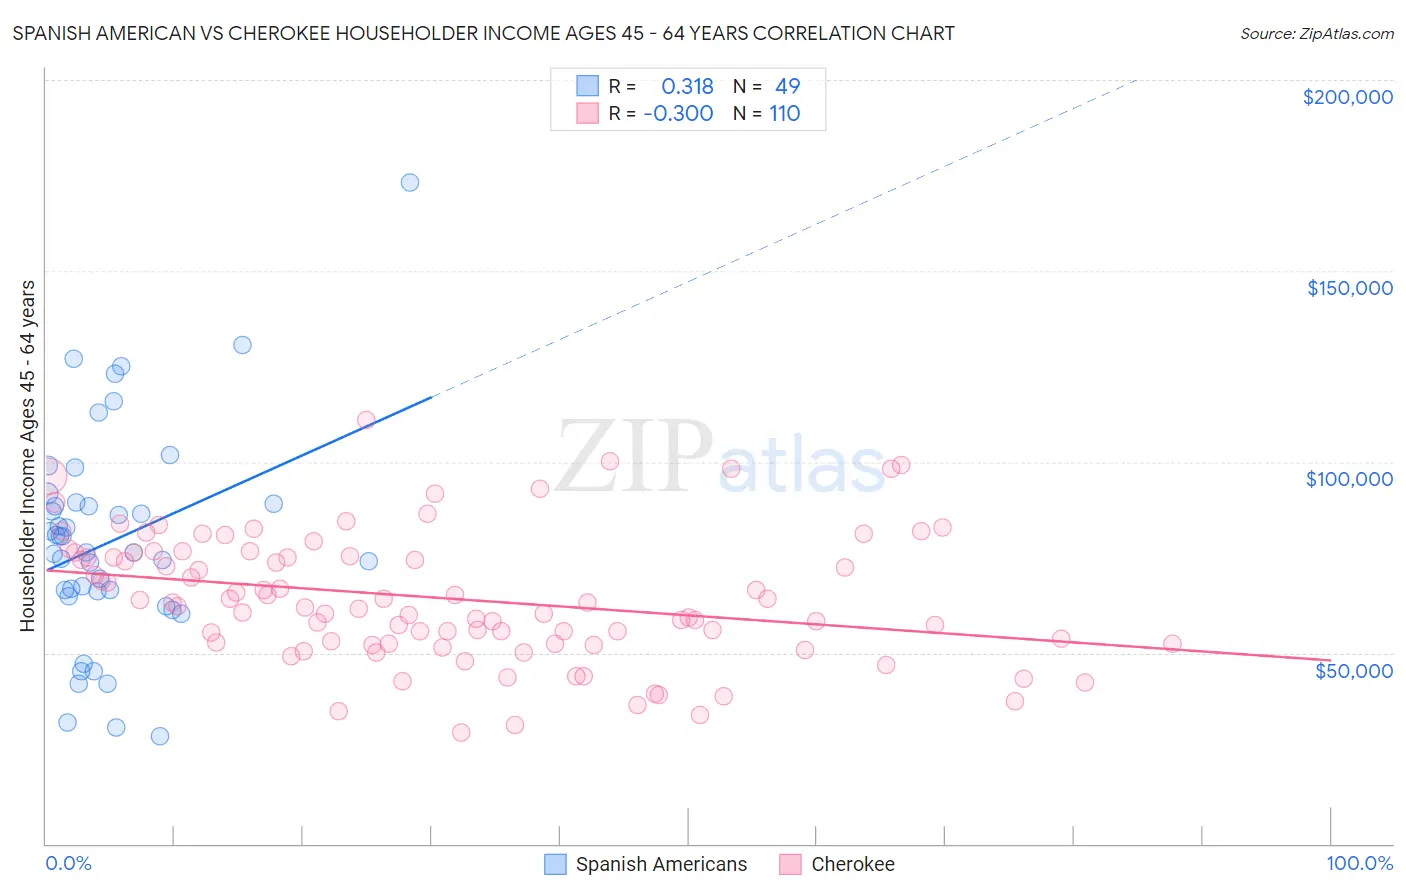
Spanish American vs Cherokee Householder Income Ages 45 - 64 years Correlation Chart
The statistical analysis conducted on geographies consisting of 103,142,376 people shows a mild positive correlation between the proportion of Spanish Americans and household income with householder between the ages 45 and 64 in the United States with a correlation coefficient (R) of 0.318 and weighted average of $87,836. Similarly, the statistical analysis conducted on geographies consisting of 491,799,921 people shows a mild negative correlation between the proportion of Cherokee and household income with householder between the ages 45 and 64 in the United States with a correlation coefficient (R) of -0.300 and weighted average of $86,125, a difference of 2.0%.
Householder Income Ages 45 - 64 years Correlation Summary
| Measurement | Spanish American | Cherokee |
| Minimum | $28,021 | $29,177 |
| Maximum | $173,295 | $110,921 |
| Range | $145,274 | $81,743 |
| Mean | $79,401 | $64,277 |
| Median | $76,250 | $62,715 |
| Interquartile 25% (IQ1) | $65,439 | $52,500 |
| Interquartile 75% (IQ3) | $89,172 | $76,245 |
| Interquartile Range (IQR) | $23,734 | $23,745 |
| Standard Deviation (Sample) | $28,080 | $16,781 |
| Standard Deviation (Population) | $27,792 | $16,705 |
Similar Demographics by Householder Income Ages 45 - 64 years
Demographics Similar to Spanish Americans by Householder Income Ages 45 - 64 years
In terms of householder income ages 45 - 64 years, the demographic groups most similar to Spanish Americans are Immigrants from Micronesia ($87,864, a difference of 0.030%), Immigrants from Liberia ($87,739, a difference of 0.11%), Guatemalan ($87,705, a difference of 0.15%), Cape Verdean ($87,580, a difference of 0.29%), and Spanish American Indian ($87,561, a difference of 0.31%).
| Demographics | Rating | Rank | Householder Income Ages 45 - 64 years |
| Somalis | 0.3 /100 | #262 | Tragic $88,600 |
| Immigrants | Senegal | 0.3 /100 | #263 | Tragic $88,421 |
| Osage | 0.3 /100 | #264 | Tragic $88,390 |
| Jamaicans | 0.2 /100 | #265 | Tragic $88,327 |
| Immigrants | West Indies | 0.2 /100 | #266 | Tragic $88,164 |
| Hmong | 0.2 /100 | #267 | Tragic $88,115 |
| Immigrants | Micronesia | 0.2 /100 | #268 | Tragic $87,864 |
| Spanish Americans | 0.2 /100 | #269 | Tragic $87,836 |
| Immigrants | Liberia | 0.2 /100 | #270 | Tragic $87,739 |
| Guatemalans | 0.2 /100 | #271 | Tragic $87,705 |
| Cape Verdeans | 0.2 /100 | #272 | Tragic $87,580 |
| Spanish American Indians | 0.2 /100 | #273 | Tragic $87,561 |
| Iroquois | 0.1 /100 | #274 | Tragic $87,255 |
| Immigrants | Belize | 0.1 /100 | #275 | Tragic $87,229 |
| Immigrants | Latin America | 0.1 /100 | #276 | Tragic $87,219 |
Demographics Similar to Cherokee by Householder Income Ages 45 - 64 years
In terms of householder income ages 45 - 64 years, the demographic groups most similar to Cherokee are Hispanic or Latino ($86,006, a difference of 0.14%), Immigrants from Central America ($85,965, a difference of 0.19%), Cuban ($86,301, a difference of 0.20%), Immigrants from St. Vincent and the Grenadines ($86,394, a difference of 0.31%), and Bangladeshi ($86,402, a difference of 0.32%).
| Demographics | Rating | Rank | Householder Income Ages 45 - 64 years |
| Mexicans | 0.1 /100 | #283 | Tragic $86,816 |
| Central American Indians | 0.1 /100 | #284 | Tragic $86,764 |
| Blackfeet | 0.1 /100 | #285 | Tragic $86,595 |
| Immigrants | Guatemala | 0.1 /100 | #286 | Tragic $86,573 |
| Bangladeshis | 0.1 /100 | #287 | Tragic $86,402 |
| Immigrants | St. Vincent and the Grenadines | 0.1 /100 | #288 | Tragic $86,394 |
| Cubans | 0.1 /100 | #289 | Tragic $86,301 |
| Cherokee | 0.1 /100 | #290 | Tragic $86,125 |
| Hispanics or Latinos | 0.1 /100 | #291 | Tragic $86,006 |
| Immigrants | Central America | 0.1 /100 | #292 | Tragic $85,965 |
| Comanche | 0.1 /100 | #293 | Tragic $85,787 |
| British West Indians | 0.1 /100 | #294 | Tragic $85,571 |
| Immigrants | Grenada | 0.1 /100 | #295 | Tragic $85,552 |
| Immigrants | Zaire | 0.1 /100 | #296 | Tragic $85,207 |
| Fijians | 0.1 /100 | #297 | Tragic $85,187 |