Spanish American Indian vs Guamanian/Chamorro Male Poverty
COMPARE
Spanish American Indian
Guamanian/Chamorro
Male Poverty
Male Poverty Comparison
Spanish American Indians
Guamanians/Chamorros
13.1%
MALE POVERTY
0.1/ 100
METRIC RATING
262nd/ 347
METRIC RANK
11.0%
MALE POVERTY
67.6/ 100
METRIC RATING
150th/ 347
METRIC RANK
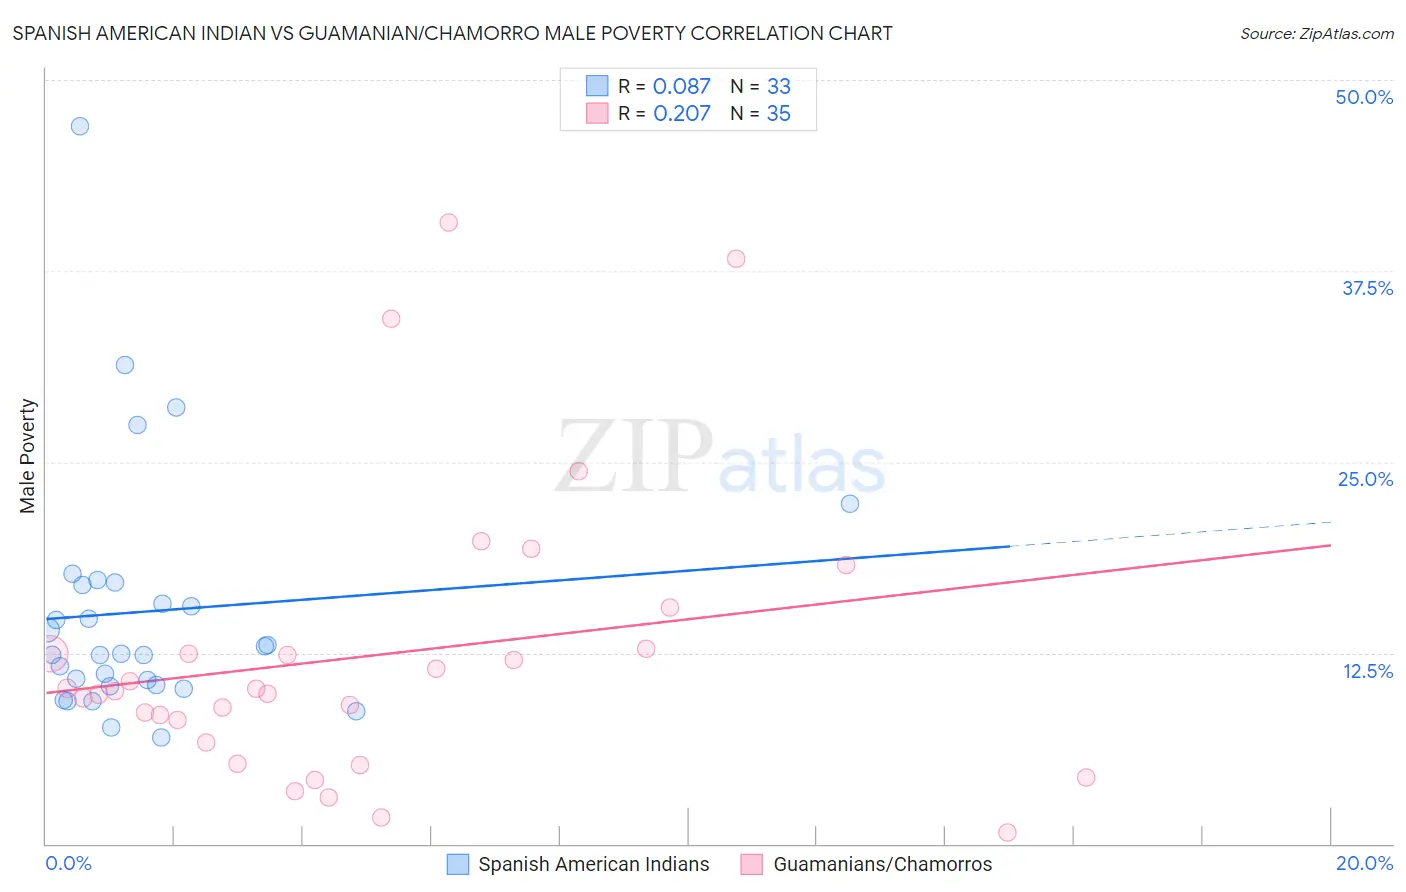
Spanish American Indian vs Guamanian/Chamorro Male Poverty Correlation Chart
The statistical analysis conducted on geographies consisting of 73,141,857 people shows a slight positive correlation between the proportion of Spanish American Indians and poverty level among males in the United States with a correlation coefficient (R) of 0.087 and weighted average of 13.1%. Similarly, the statistical analysis conducted on geographies consisting of 221,842,342 people shows a weak positive correlation between the proportion of Guamanians/Chamorros and poverty level among males in the United States with a correlation coefficient (R) of 0.207 and weighted average of 11.0%, a difference of 19.4%.
Male Poverty Correlation Summary
| Measurement | Spanish American Indian | Guamanian/Chamorro |
| Minimum | 6.9% | 0.76% |
| Maximum | 47.0% | 40.6% |
| Range | 40.0% | 39.9% |
| Mean | 15.2% | 12.3% |
| Median | 12.4% | 10.0% |
| Interquartile 25% (IQ1) | 10.4% | 6.6% |
| Interquartile 75% (IQ3) | 17.0% | 12.7% |
| Interquartile Range (IQR) | 6.6% | 6.1% |
| Standard Deviation (Sample) | 8.1% | 9.5% |
| Standard Deviation (Population) | 8.0% | 9.3% |
Similar Demographics by Male Poverty
Demographics Similar to Spanish American Indians by Male Poverty
In terms of male poverty, the demographic groups most similar to Spanish American Indians are Trinidadian and Tobagonian (13.1%, a difference of 0.050%), Ottawa (13.1%, a difference of 0.070%), Cherokee (13.1%, a difference of 0.18%), Cape Verdean (13.1%, a difference of 0.35%), and Central American (13.2%, a difference of 0.40%).
| Demographics | Rating | Rank | Male Poverty |
| Immigrants | Liberia | 0.1 /100 | #255 | Tragic 13.0% |
| Immigrants | Burma/Myanmar | 0.1 /100 | #256 | Tragic 13.0% |
| Immigrants | Trinidad and Tobago | 0.1 /100 | #257 | Tragic 13.1% |
| Cape Verdeans | 0.1 /100 | #258 | Tragic 13.1% |
| Cherokee | 0.1 /100 | #259 | Tragic 13.1% |
| Ottawa | 0.1 /100 | #260 | Tragic 13.1% |
| Trinidadians and Tobagonians | 0.1 /100 | #261 | Tragic 13.1% |
| Spanish American Indians | 0.1 /100 | #262 | Tragic 13.1% |
| Central Americans | 0.1 /100 | #263 | Tragic 13.2% |
| Iroquois | 0.1 /100 | #264 | Tragic 13.2% |
| Jamaicans | 0.1 /100 | #265 | Tragic 13.2% |
| Immigrants | Guyana | 0.1 /100 | #266 | Tragic 13.2% |
| Immigrants | Jamaica | 0.1 /100 | #267 | Tragic 13.3% |
| Sub-Saharan Africans | 0.1 /100 | #268 | Tragic 13.3% |
| Guyanese | 0.0 /100 | #269 | Tragic 13.3% |
Demographics Similar to Guamanians/Chamorros by Male Poverty
In terms of male poverty, the demographic groups most similar to Guamanians/Chamorros are Venezuelan (11.0%, a difference of 0.020%), Immigrants from Nepal (11.0%, a difference of 0.030%), Immigrants from Venezuela (11.0%, a difference of 0.040%), Armenian (11.0%, a difference of 0.050%), and Icelander (11.0%, a difference of 0.11%).
| Demographics | Rating | Rank | Male Poverty |
| Afghans | 71.9 /100 | #143 | Good 10.9% |
| Samoans | 71.8 /100 | #144 | Good 10.9% |
| Immigrants | Germany | 71.6 /100 | #145 | Good 10.9% |
| Syrians | 71.4 /100 | #146 | Good 10.9% |
| Icelanders | 68.5 /100 | #147 | Good 11.0% |
| Armenians | 68.0 /100 | #148 | Good 11.0% |
| Immigrants | Venezuela | 67.9 /100 | #149 | Good 11.0% |
| Guamanians/Chamorros | 67.6 /100 | #150 | Good 11.0% |
| Venezuelans | 67.4 /100 | #151 | Good 11.0% |
| Immigrants | Nepal | 67.3 /100 | #152 | Good 11.0% |
| Immigrants | Bosnia and Herzegovina | 65.2 /100 | #153 | Good 11.0% |
| Immigrants | Kazakhstan | 64.8 /100 | #154 | Good 11.0% |
| Immigrants | Malaysia | 64.7 /100 | #155 | Good 11.0% |
| Costa Ricans | 63.9 /100 | #156 | Good 11.0% |
| Scotch-Irish | 63.7 /100 | #157 | Good 11.0% |