Immigrants from Philippines vs Guamanian/Chamorro Male Poverty
COMPARE
Immigrants from Philippines
Guamanian/Chamorro
Male Poverty
Male Poverty Comparison
Immigrants from Philippines
Guamanians/Chamorros
10.0%
MALE POVERTY
98.7/ 100
METRIC RATING
50th/ 347
METRIC RANK
11.0%
MALE POVERTY
67.6/ 100
METRIC RATING
150th/ 347
METRIC RANK
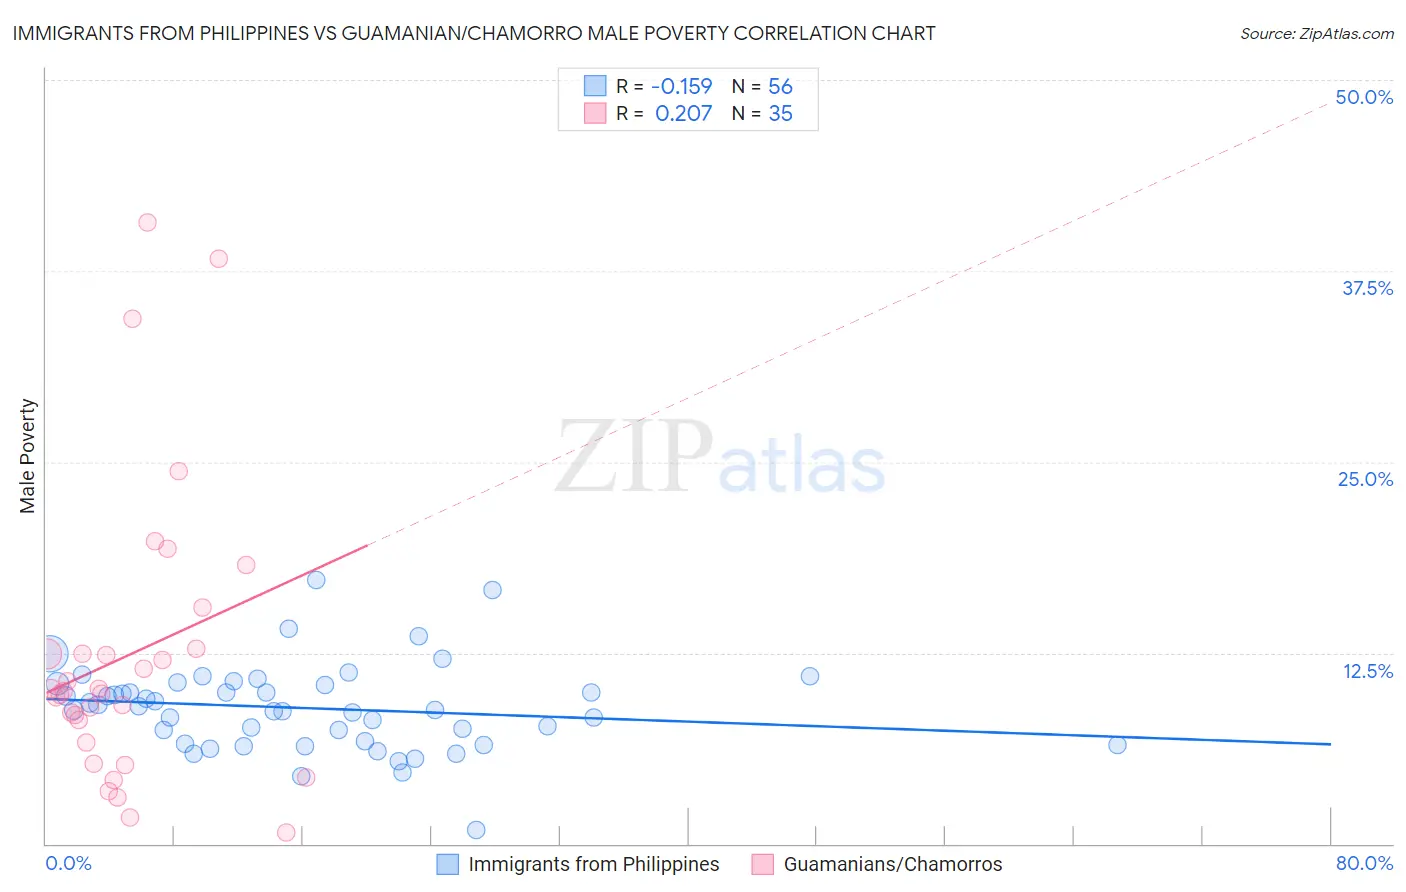
Immigrants from Philippines vs Guamanian/Chamorro Male Poverty Correlation Chart
The statistical analysis conducted on geographies consisting of 470,810,616 people shows a poor negative correlation between the proportion of Immigrants from Philippines and poverty level among males in the United States with a correlation coefficient (R) of -0.159 and weighted average of 10.0%. Similarly, the statistical analysis conducted on geographies consisting of 221,842,342 people shows a weak positive correlation between the proportion of Guamanians/Chamorros and poverty level among males in the United States with a correlation coefficient (R) of 0.207 and weighted average of 11.0%, a difference of 10.0%.
Male Poverty Correlation Summary
| Measurement | Immigrants from Philippines | Guamanian/Chamorro |
| Minimum | 0.87% | 0.76% |
| Maximum | 17.3% | 40.6% |
| Range | 16.4% | 39.9% |
| Mean | 8.9% | 12.3% |
| Median | 8.9% | 10.0% |
| Interquartile 25% (IQ1) | 6.6% | 6.6% |
| Interquartile 75% (IQ3) | 10.4% | 12.7% |
| Interquartile Range (IQR) | 3.8% | 6.1% |
| Standard Deviation (Sample) | 2.8% | 9.5% |
| Standard Deviation (Population) | 2.8% | 9.3% |
Similar Demographics by Male Poverty
Demographics Similar to Immigrants from Philippines by Male Poverty
In terms of male poverty, the demographic groups most similar to Immigrants from Philippines are Slovene (10.0%, a difference of 0.050%), Immigrants from Croatia (10.0%, a difference of 0.10%), Immigrants from Japan (10.0%, a difference of 0.14%), Immigrants from Singapore (10.0%, a difference of 0.15%), and Asian (10.0%, a difference of 0.19%).
| Demographics | Rating | Rank | Male Poverty |
| Immigrants | Moldova | 99.0 /100 | #43 | Exceptional 9.9% |
| Immigrants | Romania | 98.9 /100 | #44 | Exceptional 9.9% |
| Immigrants | Serbia | 98.9 /100 | #45 | Exceptional 10.0% |
| Turks | 98.9 /100 | #46 | Exceptional 10.0% |
| Immigrants | Singapore | 98.8 /100 | #47 | Exceptional 10.0% |
| Immigrants | Japan | 98.8 /100 | #48 | Exceptional 10.0% |
| Slovenes | 98.8 /100 | #49 | Exceptional 10.0% |
| Immigrants | Philippines | 98.7 /100 | #50 | Exceptional 10.0% |
| Immigrants | Croatia | 98.7 /100 | #51 | Exceptional 10.0% |
| Asians | 98.7 /100 | #52 | Exceptional 10.0% |
| Immigrants | Czechoslovakia | 98.6 /100 | #53 | Exceptional 10.0% |
| Immigrants | Austria | 98.5 /100 | #54 | Exceptional 10.0% |
| Germans | 98.3 /100 | #55 | Exceptional 10.1% |
| Immigrants | Bulgaria | 98.2 /100 | #56 | Exceptional 10.1% |
| Estonians | 98.1 /100 | #57 | Exceptional 10.1% |
Demographics Similar to Guamanians/Chamorros by Male Poverty
In terms of male poverty, the demographic groups most similar to Guamanians/Chamorros are Venezuelan (11.0%, a difference of 0.020%), Immigrants from Nepal (11.0%, a difference of 0.030%), Immigrants from Venezuela (11.0%, a difference of 0.040%), Armenian (11.0%, a difference of 0.050%), and Icelander (11.0%, a difference of 0.11%).
| Demographics | Rating | Rank | Male Poverty |
| Afghans | 71.9 /100 | #143 | Good 10.9% |
| Samoans | 71.8 /100 | #144 | Good 10.9% |
| Immigrants | Germany | 71.6 /100 | #145 | Good 10.9% |
| Syrians | 71.4 /100 | #146 | Good 10.9% |
| Icelanders | 68.5 /100 | #147 | Good 11.0% |
| Armenians | 68.0 /100 | #148 | Good 11.0% |
| Immigrants | Venezuela | 67.9 /100 | #149 | Good 11.0% |
| Guamanians/Chamorros | 67.6 /100 | #150 | Good 11.0% |
| Venezuelans | 67.4 /100 | #151 | Good 11.0% |
| Immigrants | Nepal | 67.3 /100 | #152 | Good 11.0% |
| Immigrants | Bosnia and Herzegovina | 65.2 /100 | #153 | Good 11.0% |
| Immigrants | Kazakhstan | 64.8 /100 | #154 | Good 11.0% |
| Immigrants | Malaysia | 64.7 /100 | #155 | Good 11.0% |
| Costa Ricans | 63.9 /100 | #156 | Good 11.0% |
| Scotch-Irish | 63.7 /100 | #157 | Good 11.0% |