Spanish American Indian vs Immigrants from Sierra Leone Male Poverty
COMPARE
Spanish American Indian
Immigrants from Sierra Leone
Male Poverty
Male Poverty Comparison
Spanish American Indians
Immigrants from Sierra Leone
13.1%
MALE POVERTY
0.1/ 100
METRIC RATING
262nd/ 347
METRIC RANK
11.4%
MALE POVERTY
32.9/ 100
METRIC RATING
186th/ 347
METRIC RANK
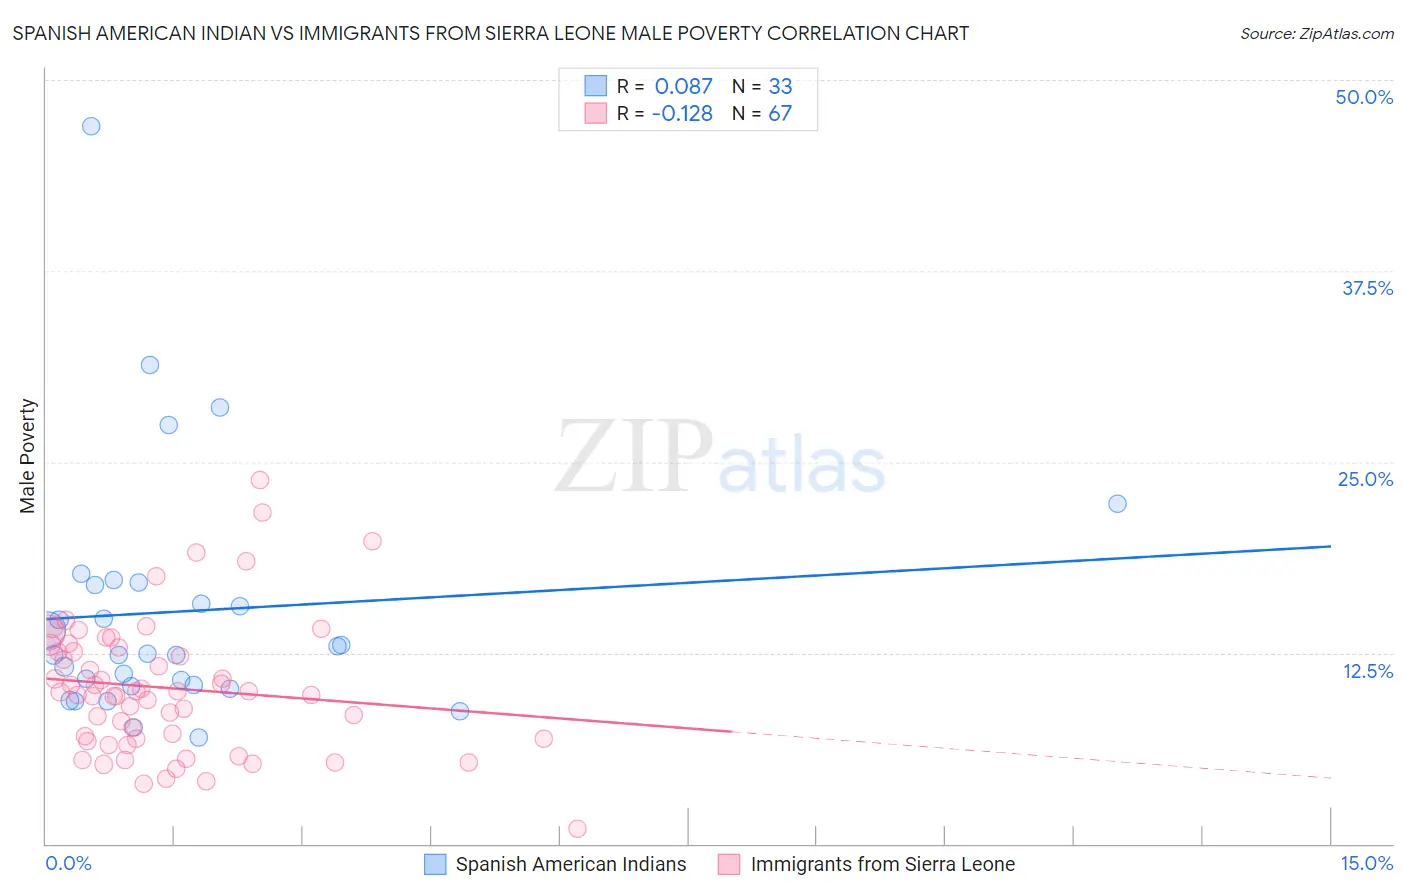
Spanish American Indian vs Immigrants from Sierra Leone Male Poverty Correlation Chart
The statistical analysis conducted on geographies consisting of 73,141,857 people shows a slight positive correlation between the proportion of Spanish American Indians and poverty level among males in the United States with a correlation coefficient (R) of 0.087 and weighted average of 13.1%. Similarly, the statistical analysis conducted on geographies consisting of 101,636,986 people shows a poor negative correlation between the proportion of Immigrants from Sierra Leone and poverty level among males in the United States with a correlation coefficient (R) of -0.128 and weighted average of 11.4%, a difference of 15.2%.
Male Poverty Correlation Summary
| Measurement | Spanish American Indian | Immigrants from Sierra Leone |
| Minimum | 6.9% | 1.0% |
| Maximum | 47.0% | 23.8% |
| Range | 40.0% | 22.8% |
| Mean | 15.2% | 10.2% |
| Median | 12.4% | 9.9% |
| Interquartile 25% (IQ1) | 10.4% | 6.9% |
| Interquartile 75% (IQ3) | 17.0% | 12.8% |
| Interquartile Range (IQR) | 6.6% | 5.9% |
| Standard Deviation (Sample) | 8.1% | 4.4% |
| Standard Deviation (Population) | 8.0% | 4.4% |
Similar Demographics by Male Poverty
Demographics Similar to Spanish American Indians by Male Poverty
In terms of male poverty, the demographic groups most similar to Spanish American Indians are Trinidadian and Tobagonian (13.1%, a difference of 0.050%), Ottawa (13.1%, a difference of 0.070%), Cherokee (13.1%, a difference of 0.18%), Cape Verdean (13.1%, a difference of 0.35%), and Central American (13.2%, a difference of 0.40%).
| Demographics | Rating | Rank | Male Poverty |
| Immigrants | Liberia | 0.1 /100 | #255 | Tragic 13.0% |
| Immigrants | Burma/Myanmar | 0.1 /100 | #256 | Tragic 13.0% |
| Immigrants | Trinidad and Tobago | 0.1 /100 | #257 | Tragic 13.1% |
| Cape Verdeans | 0.1 /100 | #258 | Tragic 13.1% |
| Cherokee | 0.1 /100 | #259 | Tragic 13.1% |
| Ottawa | 0.1 /100 | #260 | Tragic 13.1% |
| Trinidadians and Tobagonians | 0.1 /100 | #261 | Tragic 13.1% |
| Spanish American Indians | 0.1 /100 | #262 | Tragic 13.1% |
| Central Americans | 0.1 /100 | #263 | Tragic 13.2% |
| Iroquois | 0.1 /100 | #264 | Tragic 13.2% |
| Jamaicans | 0.1 /100 | #265 | Tragic 13.2% |
| Immigrants | Guyana | 0.1 /100 | #266 | Tragic 13.2% |
| Immigrants | Jamaica | 0.1 /100 | #267 | Tragic 13.3% |
| Sub-Saharan Africans | 0.1 /100 | #268 | Tragic 13.3% |
| Guyanese | 0.0 /100 | #269 | Tragic 13.3% |
Demographics Similar to Immigrants from Sierra Leone by Male Poverty
In terms of male poverty, the demographic groups most similar to Immigrants from Sierra Leone are Immigrants from Afghanistan (11.4%, a difference of 0.050%), Immigrants from Iraq (11.4%, a difference of 0.11%), Sierra Leonean (11.4%, a difference of 0.33%), Immigrants from South America (11.3%, a difference of 0.43%), and Hawaiian (11.4%, a difference of 0.52%).
| Demographics | Rating | Rank | Male Poverty |
| Immigrants | Syria | 40.3 /100 | #179 | Average 11.3% |
| Immigrants | Morocco | 40.1 /100 | #180 | Average 11.3% |
| Immigrants | Costa Rica | 39.5 /100 | #181 | Fair 11.3% |
| Mongolians | 39.0 /100 | #182 | Fair 11.3% |
| Kenyans | 38.4 /100 | #183 | Fair 11.3% |
| Immigrants | South America | 36.9 /100 | #184 | Fair 11.3% |
| Immigrants | Afghanistan | 33.3 /100 | #185 | Fair 11.4% |
| Immigrants | Sierra Leone | 32.9 /100 | #186 | Fair 11.4% |
| Immigrants | Iraq | 31.9 /100 | #187 | Fair 11.4% |
| Sierra Leoneans | 29.9 /100 | #188 | Fair 11.4% |
| Hawaiians | 28.3 /100 | #189 | Fair 11.4% |
| Israelis | 26.1 /100 | #190 | Fair 11.5% |
| South American Indians | 22.8 /100 | #191 | Fair 11.5% |
| Immigrants | Uruguay | 19.1 /100 | #192 | Poor 11.6% |
| Immigrants | Kuwait | 17.3 /100 | #193 | Poor 11.6% |