Spanish American Indian vs Immigrants from Cabo Verde Male Poverty
COMPARE
Spanish American Indian
Immigrants from Cabo Verde
Male Poverty
Male Poverty Comparison
Spanish American Indians
Immigrants from Cabo Verde
13.1%
MALE POVERTY
0.1/ 100
METRIC RATING
262nd/ 347
METRIC RANK
13.7%
MALE POVERTY
0.0/ 100
METRIC RATING
282nd/ 347
METRIC RANK
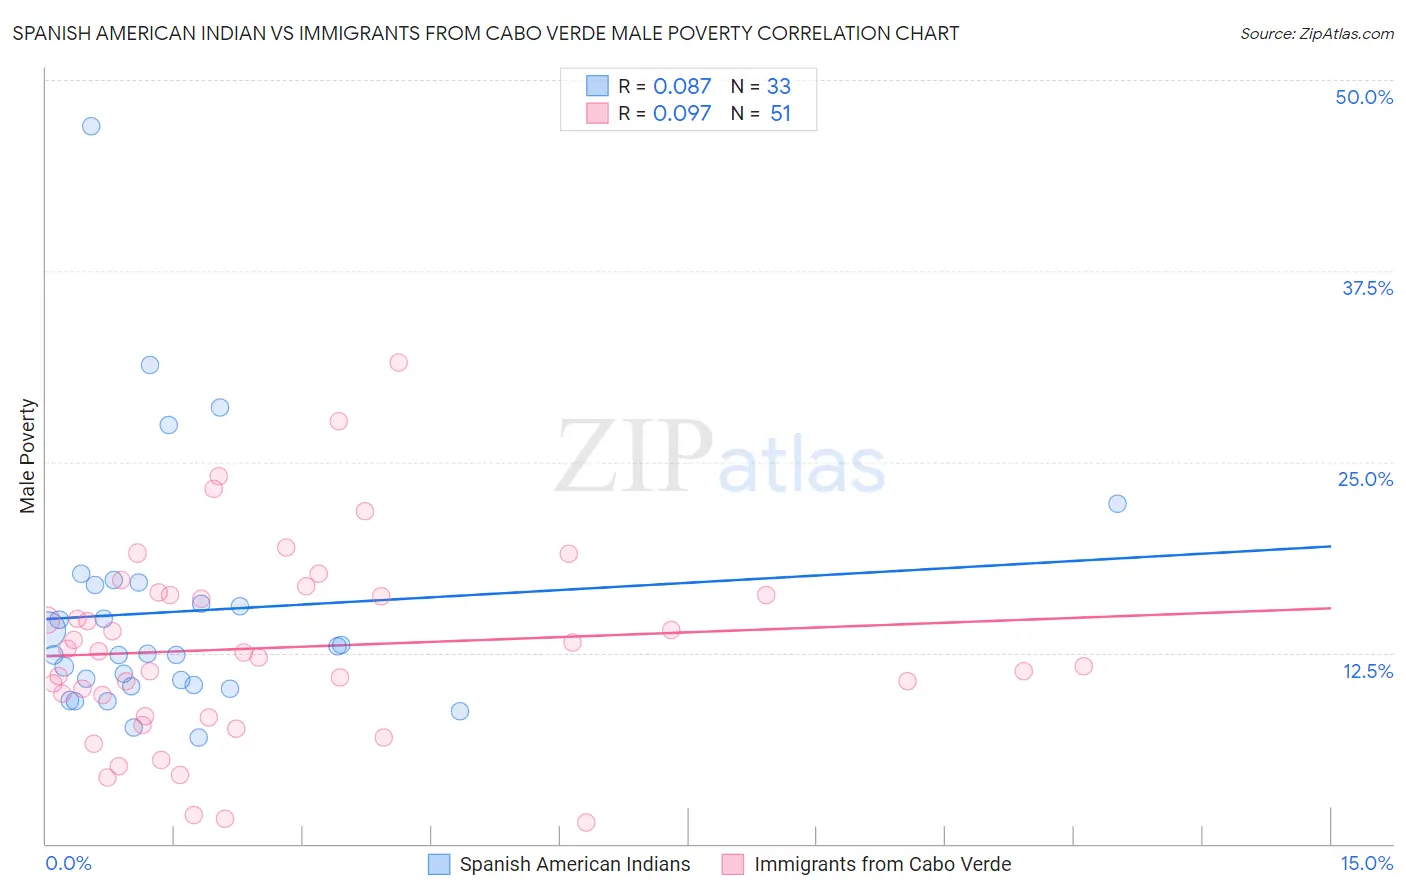
Spanish American Indian vs Immigrants from Cabo Verde Male Poverty Correlation Chart
The statistical analysis conducted on geographies consisting of 73,141,857 people shows a slight positive correlation between the proportion of Spanish American Indians and poverty level among males in the United States with a correlation coefficient (R) of 0.087 and weighted average of 13.1%. Similarly, the statistical analysis conducted on geographies consisting of 38,133,137 people shows a slight positive correlation between the proportion of Immigrants from Cabo Verde and poverty level among males in the United States with a correlation coefficient (R) of 0.097 and weighted average of 13.7%, a difference of 4.6%.
Male Poverty Correlation Summary
| Measurement | Spanish American Indian | Immigrants from Cabo Verde |
| Minimum | 6.9% | 1.4% |
| Maximum | 47.0% | 31.5% |
| Range | 40.0% | 30.1% |
| Mean | 15.2% | 12.8% |
| Median | 12.4% | 12.5% |
| Interquartile 25% (IQ1) | 10.4% | 8.4% |
| Interquartile 75% (IQ3) | 17.0% | 16.3% |
| Interquartile Range (IQR) | 6.6% | 7.9% |
| Standard Deviation (Sample) | 8.1% | 6.3% |
| Standard Deviation (Population) | 8.0% | 6.2% |
Demographics Similar to Spanish American Indians and Immigrants from Cabo Verde by Male Poverty
In terms of male poverty, the demographic groups most similar to Spanish American Indians are Central American (13.2%, a difference of 0.40%), Iroquois (13.2%, a difference of 0.76%), Jamaican (13.2%, a difference of 0.78%), Immigrants from Guyana (13.2%, a difference of 0.92%), and Immigrants from Jamaica (13.3%, a difference of 1.0%). Similarly, the demographic groups most similar to Immigrants from Cabo Verde are Yaqui (13.7%, a difference of 0.27%), Mexican (13.7%, a difference of 0.32%), Haitian (13.7%, a difference of 0.41%), Belizean (13.6%, a difference of 0.59%), and Bangladeshi (13.6%, a difference of 0.68%).
| Demographics | Rating | Rank | Male Poverty |
| Spanish American Indians | 0.1 /100 | #262 | Tragic 13.1% |
| Central Americans | 0.1 /100 | #263 | Tragic 13.2% |
| Iroquois | 0.1 /100 | #264 | Tragic 13.2% |
| Jamaicans | 0.1 /100 | #265 | Tragic 13.2% |
| Immigrants | Guyana | 0.1 /100 | #266 | Tragic 13.2% |
| Immigrants | Jamaica | 0.1 /100 | #267 | Tragic 13.3% |
| Sub-Saharan Africans | 0.1 /100 | #268 | Tragic 13.3% |
| Guyanese | 0.0 /100 | #269 | Tragic 13.3% |
| Cree | 0.0 /100 | #270 | Tragic 13.3% |
| Spanish Americans | 0.0 /100 | #271 | Tragic 13.4% |
| Immigrants | Bahamas | 0.0 /100 | #272 | Tragic 13.5% |
| Chickasaw | 0.0 /100 | #273 | Tragic 13.5% |
| Immigrants | West Indies | 0.0 /100 | #274 | Tragic 13.5% |
| Barbadians | 0.0 /100 | #275 | Tragic 13.6% |
| Immigrants | Latin America | 0.0 /100 | #276 | Tragic 13.6% |
| Bangladeshis | 0.0 /100 | #277 | Tragic 13.6% |
| Belizeans | 0.0 /100 | #278 | Tragic 13.6% |
| Haitians | 0.0 /100 | #279 | Tragic 13.7% |
| Mexicans | 0.0 /100 | #280 | Tragic 13.7% |
| Yaqui | 0.0 /100 | #281 | Tragic 13.7% |
| Immigrants | Cabo Verde | 0.0 /100 | #282 | Tragic 13.7% |