Immigrants from South Africa vs Guamanian/Chamorro Male Poverty
COMPARE
Immigrants from South Africa
Guamanian/Chamorro
Male Poverty
Male Poverty Comparison
Immigrants from South Africa
Guamanians/Chamorros
10.4%
MALE POVERTY
94.1/ 100
METRIC RATING
94th/ 347
METRIC RANK
11.0%
MALE POVERTY
67.6/ 100
METRIC RATING
150th/ 347
METRIC RANK
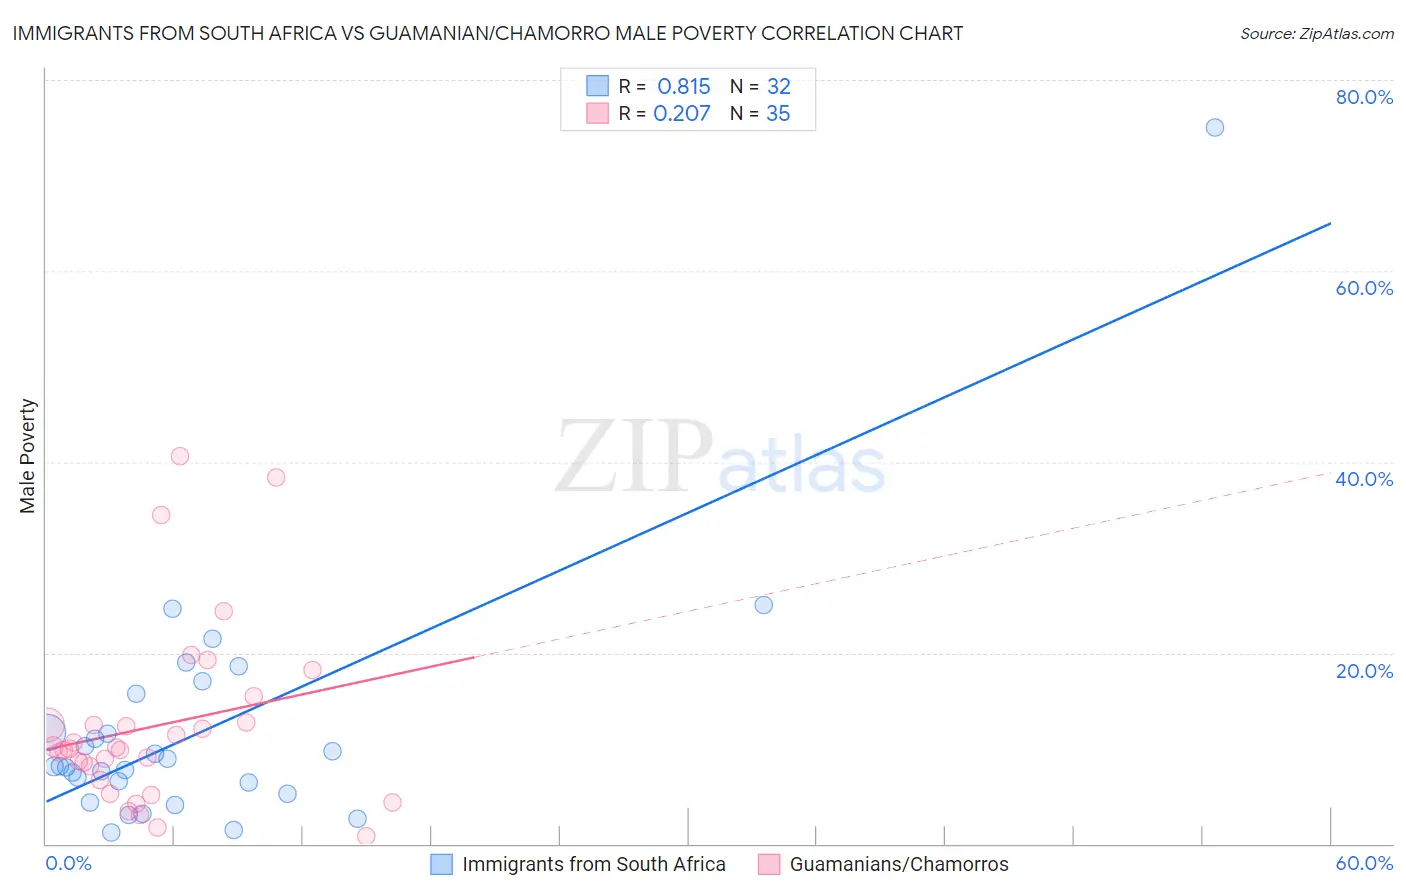
Immigrants from South Africa vs Guamanian/Chamorro Male Poverty Correlation Chart
The statistical analysis conducted on geographies consisting of 233,179,579 people shows a very strong positive correlation between the proportion of Immigrants from South Africa and poverty level among males in the United States with a correlation coefficient (R) of 0.815 and weighted average of 10.4%. Similarly, the statistical analysis conducted on geographies consisting of 221,842,342 people shows a weak positive correlation between the proportion of Guamanians/Chamorros and poverty level among males in the United States with a correlation coefficient (R) of 0.207 and weighted average of 11.0%, a difference of 5.3%.
Male Poverty Correlation Summary
| Measurement | Immigrants from South Africa | Guamanian/Chamorro |
| Minimum | 1.1% | 0.76% |
| Maximum | 75.0% | 40.6% |
| Range | 73.9% | 39.9% |
| Mean | 11.9% | 12.3% |
| Median | 8.1% | 10.0% |
| Interquartile 25% (IQ1) | 5.8% | 6.6% |
| Interquartile 75% (IQ3) | 13.7% | 12.7% |
| Interquartile Range (IQR) | 7.8% | 6.1% |
| Standard Deviation (Sample) | 13.2% | 9.5% |
| Standard Deviation (Population) | 13.0% | 9.3% |
Similar Demographics by Male Poverty
Demographics Similar to Immigrants from South Africa by Male Poverty
In terms of male poverty, the demographic groups most similar to Immigrants from South Africa are Scottish (10.4%, a difference of 0.030%), Immigrants from Egypt (10.4%, a difference of 0.16%), Jordanian (10.4%, a difference of 0.17%), Australian (10.4%, a difference of 0.17%), and Romanian (10.5%, a difference of 0.22%).
| Demographics | Rating | Rank | Male Poverty |
| Northern Europeans | 95.2 /100 | #87 | Exceptional 10.4% |
| Cambodians | 95.0 /100 | #88 | Exceptional 10.4% |
| Immigrants | Denmark | 95.0 /100 | #89 | Exceptional 10.4% |
| Indians (Asian) | 94.9 /100 | #90 | Exceptional 10.4% |
| British | 94.8 /100 | #91 | Exceptional 10.4% |
| Jordanians | 94.4 /100 | #92 | Exceptional 10.4% |
| Australians | 94.4 /100 | #93 | Exceptional 10.4% |
| Immigrants | South Africa | 94.1 /100 | #94 | Exceptional 10.4% |
| Scottish | 94.0 /100 | #95 | Exceptional 10.4% |
| Immigrants | Egypt | 93.7 /100 | #96 | Exceptional 10.4% |
| Romanians | 93.6 /100 | #97 | Exceptional 10.5% |
| Finns | 93.4 /100 | #98 | Exceptional 10.5% |
| Immigrants | Indonesia | 93.3 /100 | #99 | Exceptional 10.5% |
| Immigrants | Latvia | 92.8 /100 | #100 | Exceptional 10.5% |
| Immigrants | Zimbabwe | 92.0 /100 | #101 | Exceptional 10.5% |
Demographics Similar to Guamanians/Chamorros by Male Poverty
In terms of male poverty, the demographic groups most similar to Guamanians/Chamorros are Venezuelan (11.0%, a difference of 0.020%), Immigrants from Nepal (11.0%, a difference of 0.030%), Immigrants from Venezuela (11.0%, a difference of 0.040%), Armenian (11.0%, a difference of 0.050%), and Icelander (11.0%, a difference of 0.11%).
| Demographics | Rating | Rank | Male Poverty |
| Afghans | 71.9 /100 | #143 | Good 10.9% |
| Samoans | 71.8 /100 | #144 | Good 10.9% |
| Immigrants | Germany | 71.6 /100 | #145 | Good 10.9% |
| Syrians | 71.4 /100 | #146 | Good 10.9% |
| Icelanders | 68.5 /100 | #147 | Good 11.0% |
| Armenians | 68.0 /100 | #148 | Good 11.0% |
| Immigrants | Venezuela | 67.9 /100 | #149 | Good 11.0% |
| Guamanians/Chamorros | 67.6 /100 | #150 | Good 11.0% |
| Venezuelans | 67.4 /100 | #151 | Good 11.0% |
| Immigrants | Nepal | 67.3 /100 | #152 | Good 11.0% |
| Immigrants | Bosnia and Herzegovina | 65.2 /100 | #153 | Good 11.0% |
| Immigrants | Kazakhstan | 64.8 /100 | #154 | Good 11.0% |
| Immigrants | Malaysia | 64.7 /100 | #155 | Good 11.0% |
| Costa Ricans | 63.9 /100 | #156 | Good 11.0% |
| Scotch-Irish | 63.7 /100 | #157 | Good 11.0% |