Spaniard vs New Zealander Single Male Poverty
COMPARE
Spaniard
New Zealander
Single Male Poverty
Single Male Poverty Comparison
Spaniards
New Zealanders
13.7%
SINGLE MALE POVERTY
0.4/ 100
METRIC RATING
255th/ 347
METRIC RANK
13.2%
SINGLE MALE POVERTY
10.7/ 100
METRIC RATING
221st/ 347
METRIC RANK
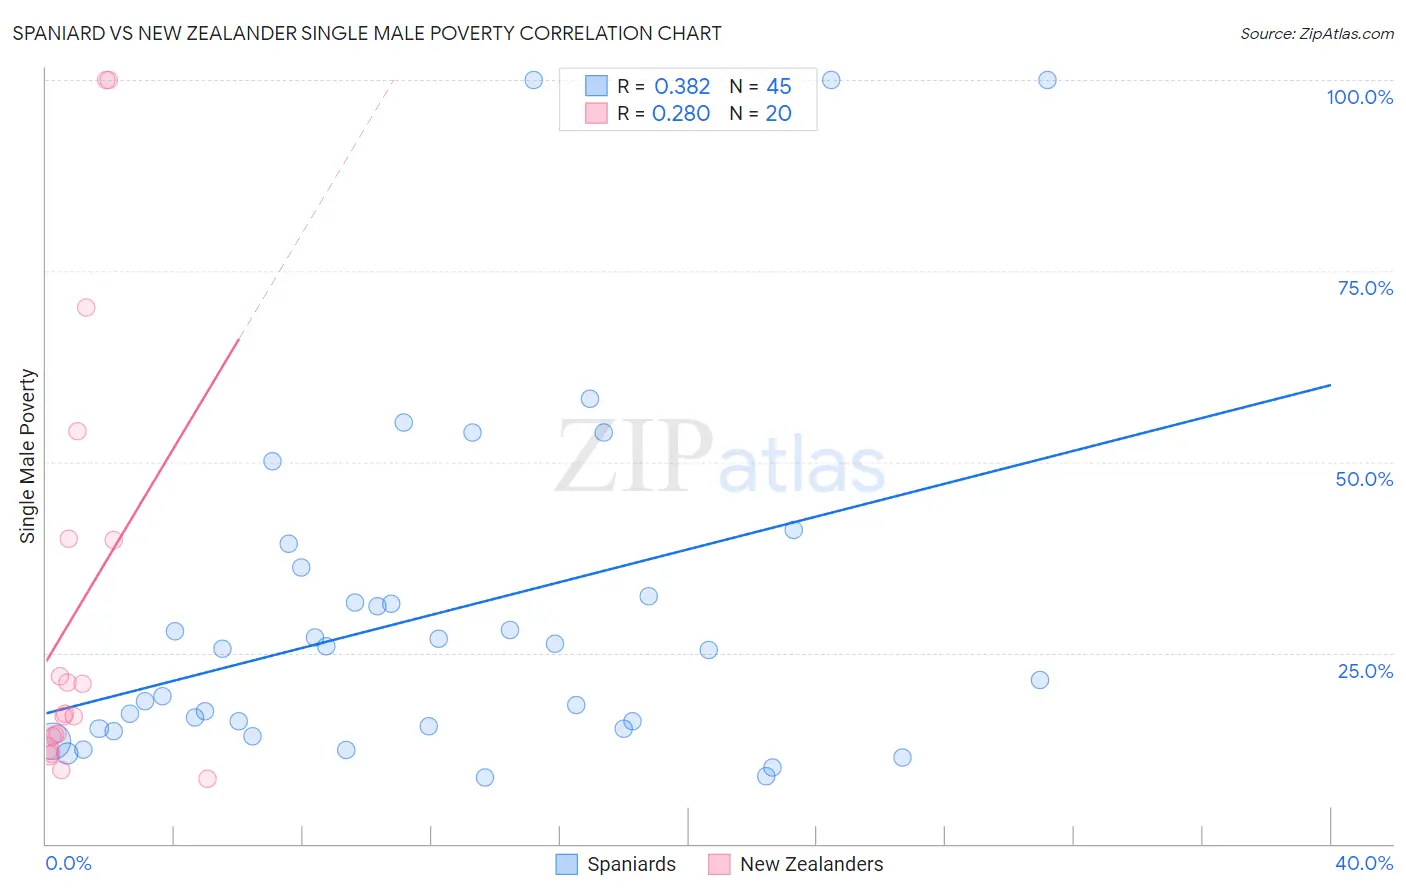
Spaniard vs New Zealander Single Male Poverty Correlation Chart
The statistical analysis conducted on geographies consisting of 390,345,278 people shows a mild positive correlation between the proportion of Spaniards and poverty level among single males in the United States with a correlation coefficient (R) of 0.382 and weighted average of 13.7%. Similarly, the statistical analysis conducted on geographies consisting of 101,681,215 people shows a weak positive correlation between the proportion of New Zealanders and poverty level among single males in the United States with a correlation coefficient (R) of 0.280 and weighted average of 13.2%, a difference of 4.2%.
Single Male Poverty Correlation Summary
| Measurement | Spaniard | New Zealander |
| Minimum | 8.7% | 8.6% |
| Maximum | 100.0% | 100.0% |
| Range | 91.3% | 91.4% |
| Mean | 30.0% | 30.8% |
| Median | 25.4% | 16.9% |
| Interquartile 25% (IQ1) | 15.0% | 13.3% |
| Interquartile 75% (IQ3) | 34.3% | 39.9% |
| Interquartile Range (IQR) | 19.3% | 26.6% |
| Standard Deviation (Sample) | 23.1% | 28.6% |
| Standard Deviation (Population) | 22.8% | 27.9% |
Similar Demographics by Single Male Poverty
Demographics Similar to Spaniards by Single Male Poverty
In terms of single male poverty, the demographic groups most similar to Spaniards are Immigrants from Belize (13.7%, a difference of 0.10%), Subsaharan African (13.7%, a difference of 0.11%), Immigrants from Central America (13.8%, a difference of 0.29%), Immigrants from Guatemala (13.8%, a difference of 0.35%), and Guatemalan (13.8%, a difference of 0.39%).
| Demographics | Rating | Rank | Single Male Poverty |
| Czechs | 1.2 /100 | #248 | Tragic 13.5% |
| Spanish | 1.0 /100 | #249 | Tragic 13.6% |
| Immigrants | Somalia | 1.0 /100 | #250 | Tragic 13.6% |
| Immigrants | Zaire | 0.9 /100 | #251 | Tragic 13.6% |
| Finns | 0.9 /100 | #252 | Tragic 13.6% |
| German Russians | 0.8 /100 | #253 | Tragic 13.6% |
| Sub-Saharan Africans | 0.5 /100 | #254 | Tragic 13.7% |
| Spaniards | 0.4 /100 | #255 | Tragic 13.7% |
| Immigrants | Belize | 0.4 /100 | #256 | Tragic 13.7% |
| Immigrants | Central America | 0.3 /100 | #257 | Tragic 13.8% |
| Immigrants | Guatemala | 0.3 /100 | #258 | Tragic 13.8% |
| Guatemalans | 0.3 /100 | #259 | Tragic 13.8% |
| Swiss | 0.3 /100 | #260 | Tragic 13.8% |
| Hungarians | 0.3 /100 | #261 | Tragic 13.8% |
| Fijians | 0.3 /100 | #262 | Tragic 13.8% |
Demographics Similar to New Zealanders by Single Male Poverty
In terms of single male poverty, the demographic groups most similar to New Zealanders are Central American (13.2%, a difference of 0.020%), Immigrants from Western Europe (13.2%, a difference of 0.090%), Immigrants from the Azores (13.2%, a difference of 0.20%), Immigrants from Burma/Myanmar (13.1%, a difference of 0.24%), and Somali (13.2%, a difference of 0.24%).
| Demographics | Rating | Rank | Single Male Poverty |
| Zimbabweans | 14.9 /100 | #214 | Poor 13.1% |
| Japanese | 14.8 /100 | #215 | Poor 13.1% |
| Austrians | 13.9 /100 | #216 | Poor 13.1% |
| Bermudans | 13.0 /100 | #217 | Poor 13.1% |
| Scandinavians | 12.9 /100 | #218 | Poor 13.1% |
| Immigrants | Burma/Myanmar | 12.6 /100 | #219 | Poor 13.1% |
| Central Americans | 10.9 /100 | #220 | Poor 13.2% |
| New Zealanders | 10.7 /100 | #221 | Poor 13.2% |
| Immigrants | Western Europe | 10.0 /100 | #222 | Poor 13.2% |
| Immigrants | Azores | 9.3 /100 | #223 | Tragic 13.2% |
| Somalis | 9.1 /100 | #224 | Tragic 13.2% |
| Immigrants | Denmark | 8.7 /100 | #225 | Tragic 13.2% |
| Jamaicans | 7.7 /100 | #226 | Tragic 13.2% |
| Haitians | 7.0 /100 | #227 | Tragic 13.2% |
| Lebanese | 6.6 /100 | #228 | Tragic 13.2% |