Spaniard vs Bahamian Single Male Poverty
COMPARE
Spaniard
Bahamian
Single Male Poverty
Single Male Poverty Comparison
Spaniards
Bahamians
13.7%
SINGLE MALE POVERTY
0.4/ 100
METRIC RATING
255th/ 347
METRIC RANK
14.6%
SINGLE MALE POVERTY
0.0/ 100
METRIC RATING
291st/ 347
METRIC RANK
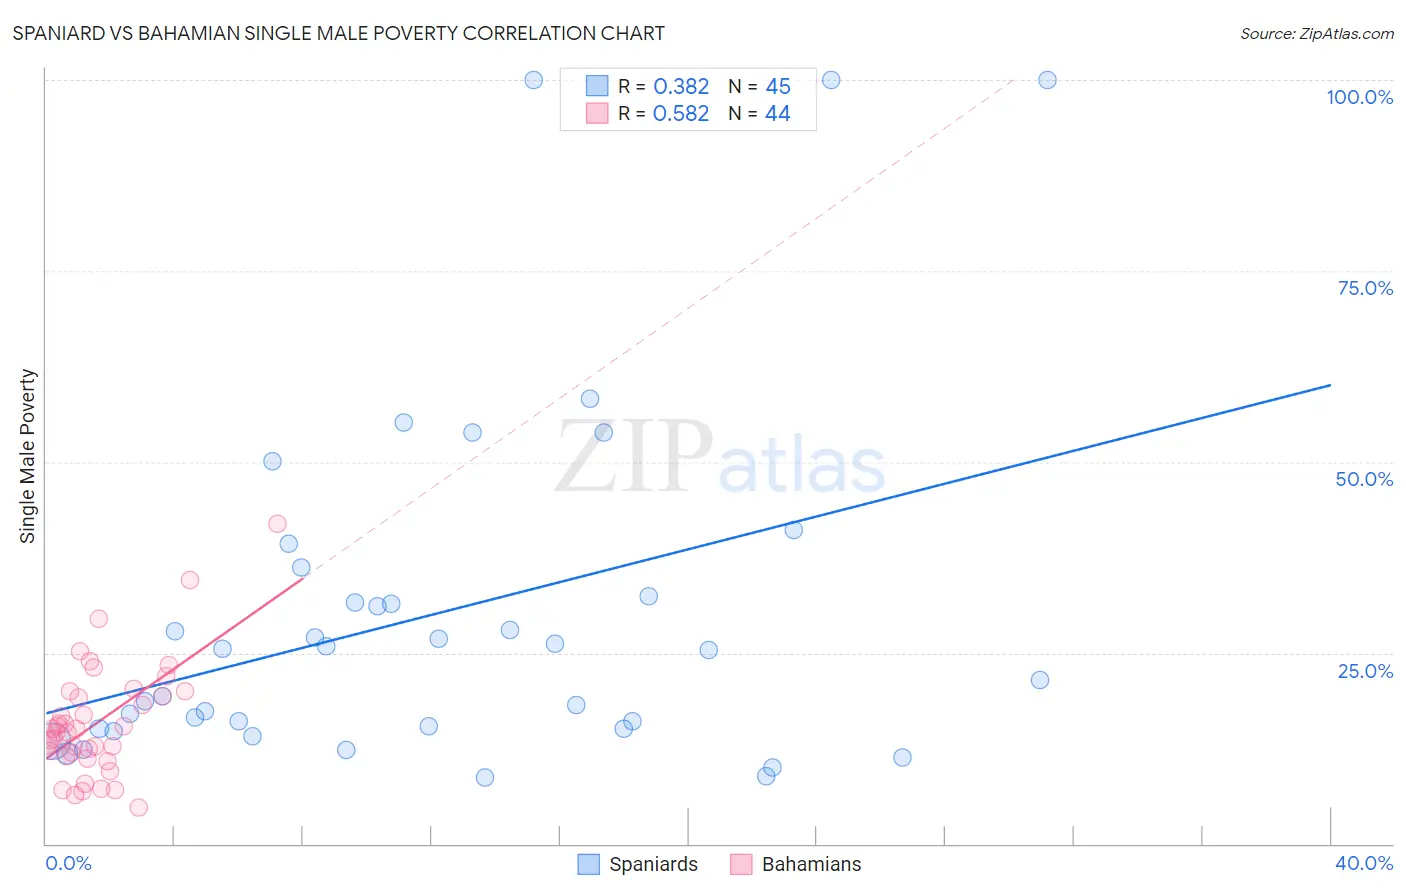
Spaniard vs Bahamian Single Male Poverty Correlation Chart
The statistical analysis conducted on geographies consisting of 390,345,278 people shows a mild positive correlation between the proportion of Spaniards and poverty level among single males in the United States with a correlation coefficient (R) of 0.382 and weighted average of 13.7%. Similarly, the statistical analysis conducted on geographies consisting of 108,151,039 people shows a substantial positive correlation between the proportion of Bahamians and poverty level among single males in the United States with a correlation coefficient (R) of 0.582 and weighted average of 14.6%, a difference of 6.1%.
Single Male Poverty Correlation Summary
| Measurement | Spaniard | Bahamian |
| Minimum | 8.7% | 4.8% |
| Maximum | 100.0% | 41.8% |
| Range | 91.3% | 37.0% |
| Mean | 30.0% | 15.9% |
| Median | 25.4% | 14.8% |
| Interquartile 25% (IQ1) | 15.0% | 11.7% |
| Interquartile 75% (IQ3) | 34.3% | 19.6% |
| Interquartile Range (IQR) | 19.3% | 7.9% |
| Standard Deviation (Sample) | 23.1% | 7.4% |
| Standard Deviation (Population) | 22.8% | 7.4% |
Similar Demographics by Single Male Poverty
Demographics Similar to Spaniards by Single Male Poverty
In terms of single male poverty, the demographic groups most similar to Spaniards are Immigrants from Belize (13.7%, a difference of 0.10%), Subsaharan African (13.7%, a difference of 0.11%), Immigrants from Central America (13.8%, a difference of 0.29%), Immigrants from Guatemala (13.8%, a difference of 0.35%), and Guatemalan (13.8%, a difference of 0.39%).
| Demographics | Rating | Rank | Single Male Poverty |
| Czechs | 1.2 /100 | #248 | Tragic 13.5% |
| Spanish | 1.0 /100 | #249 | Tragic 13.6% |
| Immigrants | Somalia | 1.0 /100 | #250 | Tragic 13.6% |
| Immigrants | Zaire | 0.9 /100 | #251 | Tragic 13.6% |
| Finns | 0.9 /100 | #252 | Tragic 13.6% |
| German Russians | 0.8 /100 | #253 | Tragic 13.6% |
| Sub-Saharan Africans | 0.5 /100 | #254 | Tragic 13.7% |
| Spaniards | 0.4 /100 | #255 | Tragic 13.7% |
| Immigrants | Belize | 0.4 /100 | #256 | Tragic 13.7% |
| Immigrants | Central America | 0.3 /100 | #257 | Tragic 13.8% |
| Immigrants | Guatemala | 0.3 /100 | #258 | Tragic 13.8% |
| Guatemalans | 0.3 /100 | #259 | Tragic 13.8% |
| Swiss | 0.3 /100 | #260 | Tragic 13.8% |
| Hungarians | 0.3 /100 | #261 | Tragic 13.8% |
| Fijians | 0.3 /100 | #262 | Tragic 13.8% |
Demographics Similar to Bahamians by Single Male Poverty
In terms of single male poverty, the demographic groups most similar to Bahamians are Nonimmigrants (14.6%, a difference of 0.13%), U.S. Virgin Islander (14.5%, a difference of 0.15%), French Canadian (14.6%, a difference of 0.25%), Immigrants from Dominica (14.5%, a difference of 0.38%), and Ottawa (14.6%, a difference of 0.43%).
| Demographics | Rating | Rank | Single Male Poverty |
| Immigrants | Bahamas | 0.0 /100 | #284 | Tragic 14.4% |
| French | 0.0 /100 | #285 | Tragic 14.4% |
| Celtics | 0.0 /100 | #286 | Tragic 14.5% |
| Iroquois | 0.0 /100 | #287 | Tragic 14.5% |
| Whites/Caucasians | 0.0 /100 | #288 | Tragic 14.5% |
| Immigrants | Dominica | 0.0 /100 | #289 | Tragic 14.5% |
| U.S. Virgin Islanders | 0.0 /100 | #290 | Tragic 14.5% |
| Bahamians | 0.0 /100 | #291 | Tragic 14.6% |
| Immigrants | Nonimmigrants | 0.0 /100 | #292 | Tragic 14.6% |
| French Canadians | 0.0 /100 | #293 | Tragic 14.6% |
| Ottawa | 0.0 /100 | #294 | Tragic 14.6% |
| Scotch-Irish | 0.0 /100 | #295 | Tragic 14.7% |
| Africans | 0.0 /100 | #296 | Tragic 14.7% |
| Immigrants | Dominican Republic | 0.0 /100 | #297 | Tragic 14.8% |
| French American Indians | 0.0 /100 | #298 | Tragic 15.0% |