Immigrants from Latin America vs Immigrants from Eritrea Married-Couple Family Poverty
COMPARE
Immigrants from Latin America
Immigrants from Eritrea
Married-Couple Family Poverty
Married-Couple Family Poverty Comparison
Immigrants from Latin America
Immigrants from Eritrea
7.2%
MARRIED-COUPLE FAMILY POVERTY
0.0/ 100
METRIC RATING
319th/ 347
METRIC RANK
5.9%
MARRIED-COUPLE FAMILY POVERTY
1.1/ 100
METRIC RATING
250th/ 347
METRIC RANK
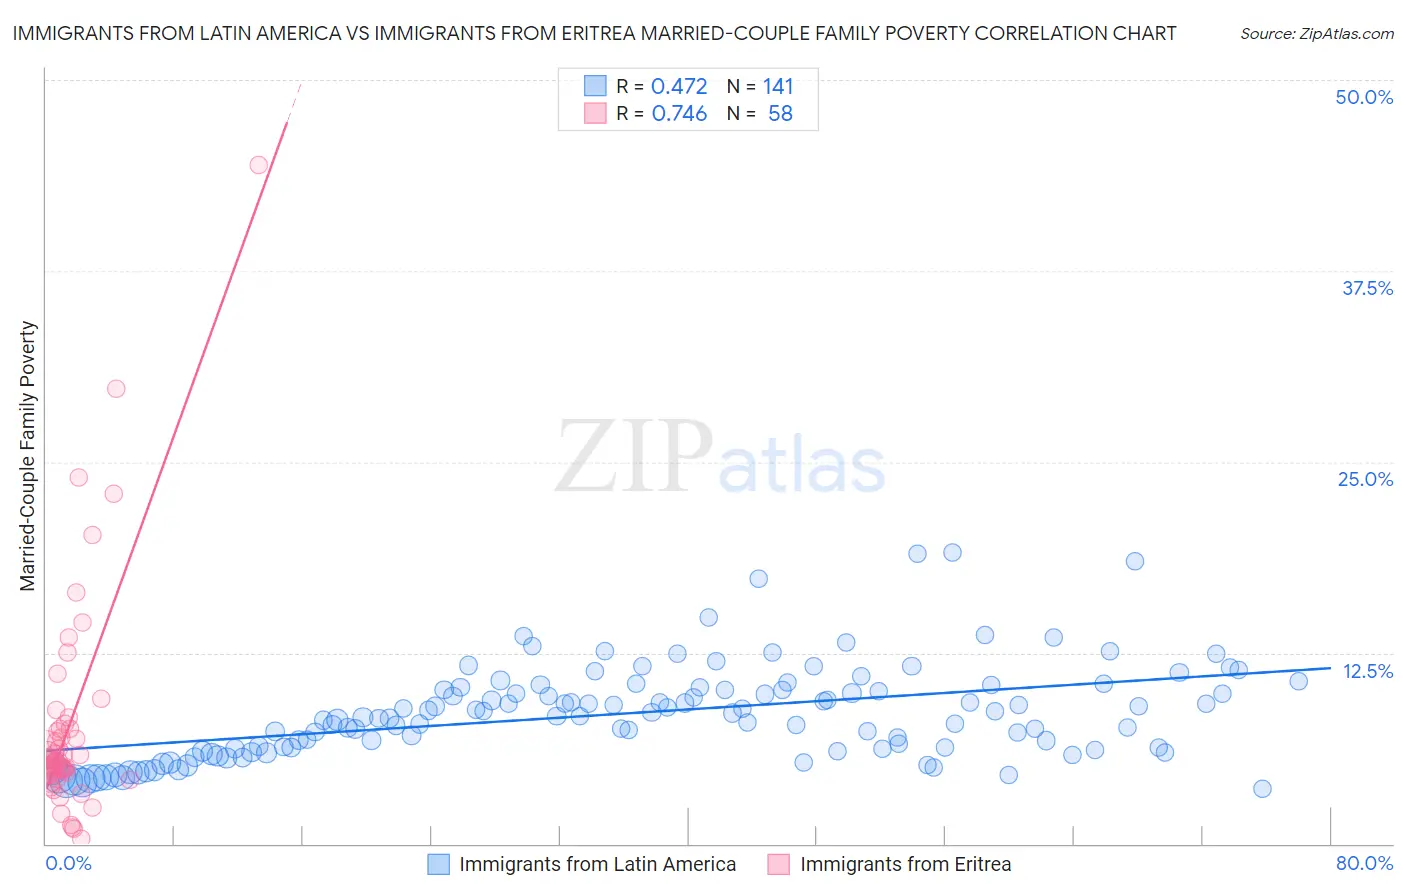
Immigrants from Latin America vs Immigrants from Eritrea Married-Couple Family Poverty Correlation Chart
The statistical analysis conducted on geographies consisting of 546,700,324 people shows a moderate positive correlation between the proportion of Immigrants from Latin America and poverty level among married-couple families in the United States with a correlation coefficient (R) of 0.472 and weighted average of 7.2%. Similarly, the statistical analysis conducted on geographies consisting of 104,722,236 people shows a strong positive correlation between the proportion of Immigrants from Eritrea and poverty level among married-couple families in the United States with a correlation coefficient (R) of 0.746 and weighted average of 5.9%, a difference of 21.9%.
Married-Couple Family Poverty Correlation Summary
| Measurement | Immigrants from Latin America | Immigrants from Eritrea |
| Minimum | 3.6% | 0.29% |
| Maximum | 19.1% | 44.4% |
| Range | 15.5% | 44.2% |
| Mean | 8.5% | 7.8% |
| Median | 8.3% | 5.4% |
| Interquartile 25% (IQ1) | 6.2% | 4.7% |
| Interquartile 75% (IQ3) | 10.1% | 7.5% |
| Interquartile Range (IQR) | 3.9% | 2.8% |
| Standard Deviation (Sample) | 3.0% | 7.5% |
| Standard Deviation (Population) | 3.0% | 7.4% |
Similar Demographics by Married-Couple Family Poverty
Demographics Similar to Immigrants from Latin America by Married-Couple Family Poverty
In terms of married-couple family poverty, the demographic groups most similar to Immigrants from Latin America are Immigrants from Guatemala (7.2%, a difference of 0.17%), Mexican (7.2%, a difference of 0.34%), Honduran (7.2%, a difference of 0.65%), Inupiat (7.1%, a difference of 0.81%), and British West Indian (7.1%, a difference of 1.1%).
| Demographics | Rating | Rank | Married-Couple Family Poverty |
| Immigrants | Armenia | 0.0 /100 | #312 | Tragic 7.1% |
| Immigrants | St. Vincent and the Grenadines | 0.0 /100 | #313 | Tragic 7.1% |
| British West Indians | 0.0 /100 | #314 | Tragic 7.1% |
| Inupiat | 0.0 /100 | #315 | Tragic 7.1% |
| Hondurans | 0.0 /100 | #316 | Tragic 7.2% |
| Mexicans | 0.0 /100 | #317 | Tragic 7.2% |
| Immigrants | Guatemala | 0.0 /100 | #318 | Tragic 7.2% |
| Immigrants | Latin America | 0.0 /100 | #319 | Tragic 7.2% |
| Immigrants | Grenada | 0.0 /100 | #320 | Tragic 7.3% |
| Immigrants | Caribbean | 0.0 /100 | #321 | Tragic 7.3% |
| Immigrants | Honduras | 0.0 /100 | #322 | Tragic 7.3% |
| Vietnamese | 0.0 /100 | #323 | Tragic 7.4% |
| Immigrants | Central America | 0.0 /100 | #324 | Tragic 7.4% |
| Immigrants | Cuba | 0.0 /100 | #325 | Tragic 7.5% |
| Immigrants | Bangladesh | 0.0 /100 | #326 | Tragic 7.5% |
Demographics Similar to Immigrants from Eritrea by Married-Couple Family Poverty
In terms of married-couple family poverty, the demographic groups most similar to Immigrants from Eritrea are Tsimshian (5.9%, a difference of 0.21%), Immigrants from Ghana (5.9%, a difference of 0.25%), Cree (5.9%, a difference of 0.31%), Iraqi (5.9%, a difference of 0.74%), and Immigrants from Western Asia (6.0%, a difference of 0.89%).
| Demographics | Rating | Rank | Married-Couple Family Poverty |
| Somalis | 2.3 /100 | #243 | Tragic 5.8% |
| Chickasaw | 2.3 /100 | #244 | Tragic 5.8% |
| Immigrants | Afghanistan | 2.1 /100 | #245 | Tragic 5.8% |
| Immigrants | Venezuela | 1.8 /100 | #246 | Tragic 5.8% |
| Iraqis | 1.4 /100 | #247 | Tragic 5.9% |
| Cree | 1.2 /100 | #248 | Tragic 5.9% |
| Tsimshian | 1.1 /100 | #249 | Tragic 5.9% |
| Immigrants | Eritrea | 1.1 /100 | #250 | Tragic 5.9% |
| Immigrants | Ghana | 1.0 /100 | #251 | Tragic 5.9% |
| Immigrants | Western Asia | 0.7 /100 | #252 | Tragic 6.0% |
| Africans | 0.7 /100 | #253 | Tragic 6.0% |
| Immigrants | Somalia | 0.7 /100 | #254 | Tragic 6.0% |
| Comanche | 0.7 /100 | #255 | Tragic 6.0% |
| Bangladeshis | 0.5 /100 | #256 | Tragic 6.0% |
| Immigrants | Burma/Myanmar | 0.5 /100 | #257 | Tragic 6.0% |