South American vs Osage Child Poverty Among Girls Under 16
COMPARE
South American
Osage
Child Poverty Among Girls Under 16
Child Poverty Among Girls Under 16 Comparison
South Americans
Osage
16.1%
CHILD POVERTY AMONG GIRLS UNDER 16
67.2/ 100
METRIC RATING
166th/ 347
METRIC RANK
18.5%
CHILD POVERTY AMONG GIRLS UNDER 16
1.3/ 100
METRIC RATING
230th/ 347
METRIC RANK
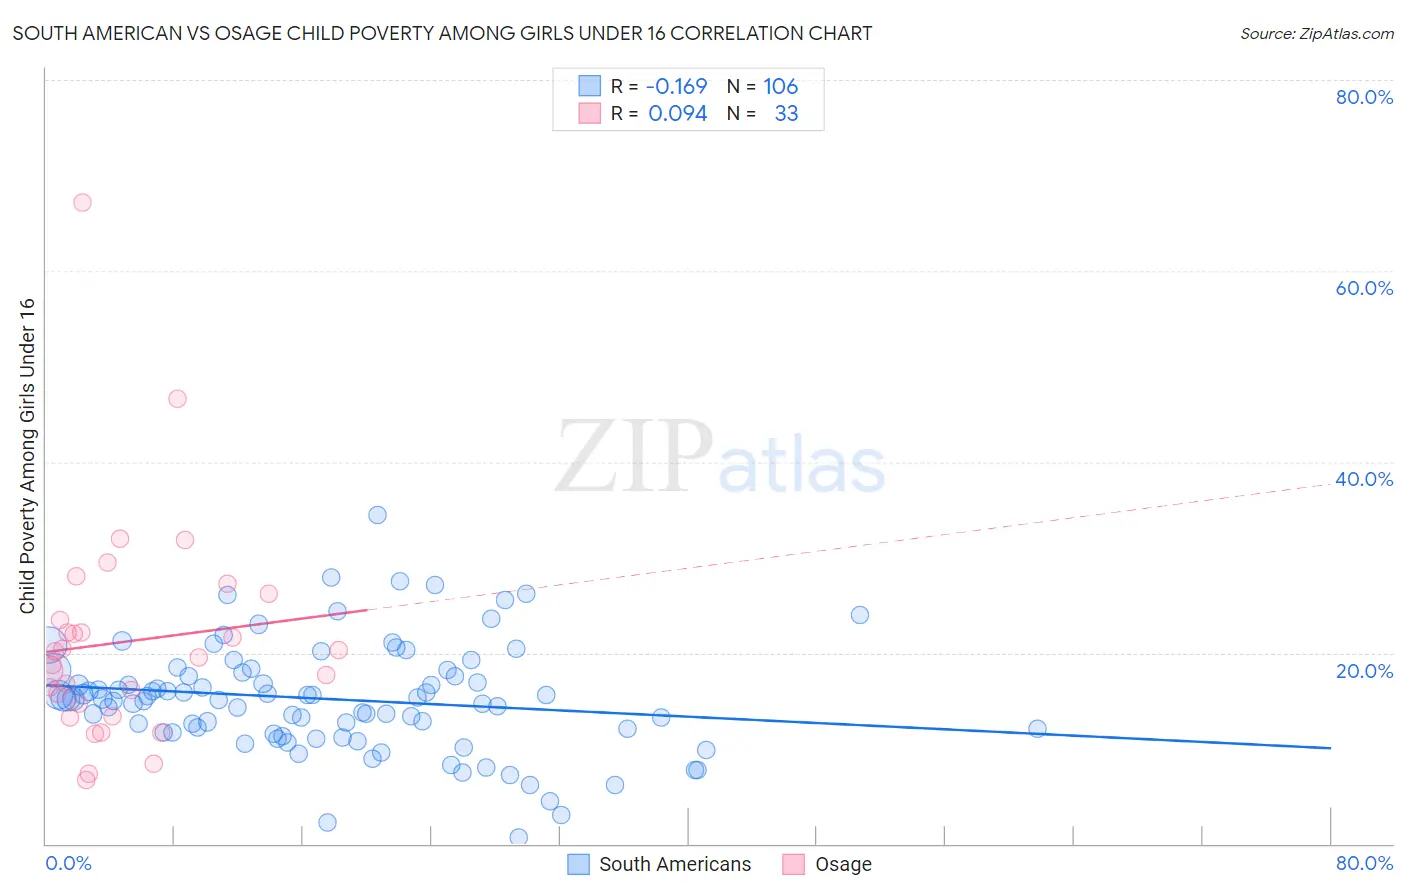
South American vs Osage Child Poverty Among Girls Under 16 Correlation Chart
The statistical analysis conducted on geographies consisting of 481,449,574 people shows a poor negative correlation between the proportion of South Americans and poverty level among girls under the age of 16 in the United States with a correlation coefficient (R) of -0.169 and weighted average of 16.1%. Similarly, the statistical analysis conducted on geographies consisting of 91,492,643 people shows a slight positive correlation between the proportion of Osage and poverty level among girls under the age of 16 in the United States with a correlation coefficient (R) of 0.094 and weighted average of 18.5%, a difference of 14.8%.
Child Poverty Among Girls Under 16 Correlation Summary
| Measurement | South American | Osage |
| Minimum | 0.69% | 6.7% |
| Maximum | 34.5% | 67.2% |
| Range | 33.8% | 60.5% |
| Mean | 15.2% | 21.1% |
| Median | 15.1% | 19.5% |
| Interquartile 25% (IQ1) | 11.7% | 14.0% |
| Interquartile 75% (IQ3) | 17.9% | 24.8% |
| Interquartile Range (IQR) | 6.2% | 10.8% |
| Standard Deviation (Sample) | 5.7% | 11.6% |
| Standard Deviation (Population) | 5.7% | 11.4% |
Similar Demographics by Child Poverty Among Girls Under 16
Demographics Similar to South Americans by Child Poverty Among Girls Under 16
In terms of child poverty among girls under 16, the demographic groups most similar to South Americans are Immigrants from Germany (16.1%, a difference of 0.020%), Immigrants from Colombia (16.1%, a difference of 0.090%), Immigrants from Oceania (16.1%, a difference of 0.16%), French Canadian (16.1%, a difference of 0.21%), and Uruguayan (16.2%, a difference of 0.32%).
| Demographics | Rating | Rank | Child Poverty Among Girls Under 16 |
| Slovaks | 75.2 /100 | #159 | Good 15.9% |
| French | 72.8 /100 | #160 | Good 16.0% |
| Immigrants | Northern Africa | 72.0 /100 | #161 | Good 16.0% |
| French Canadians | 68.7 /100 | #162 | Good 16.1% |
| Immigrants | Oceania | 68.4 /100 | #163 | Good 16.1% |
| Immigrants | Colombia | 67.8 /100 | #164 | Good 16.1% |
| Immigrants | Germany | 67.3 /100 | #165 | Good 16.1% |
| South Americans | 67.2 /100 | #166 | Good 16.1% |
| Uruguayans | 64.7 /100 | #167 | Good 16.2% |
| Yugoslavians | 64.4 /100 | #168 | Good 16.2% |
| Costa Ricans | 64.2 /100 | #169 | Good 16.2% |
| Immigrants | Venezuela | 64.2 /100 | #170 | Good 16.2% |
| Immigrants | Saudi Arabia | 64.0 /100 | #171 | Good 16.2% |
| Afghans | 62.3 /100 | #172 | Good 16.2% |
| Immigrants | South America | 55.1 /100 | #173 | Average 16.4% |
Demographics Similar to Osage by Child Poverty Among Girls Under 16
In terms of child poverty among girls under 16, the demographic groups most similar to Osage are Cree (18.5%, a difference of 0.080%), Ghanaian (18.5%, a difference of 0.19%), Immigrants from Sudan (18.6%, a difference of 0.32%), Sudanese (18.6%, a difference of 0.37%), and Fijian (18.6%, a difference of 0.43%).
| Demographics | Rating | Rank | Child Poverty Among Girls Under 16 |
| Immigrants | Armenia | 2.9 /100 | #223 | Tragic 18.1% |
| Bermudans | 2.8 /100 | #224 | Tragic 18.1% |
| Immigrants | Africa | 2.7 /100 | #225 | Tragic 18.2% |
| Nicaraguans | 2.4 /100 | #226 | Tragic 18.2% |
| Immigrants | Nonimmigrants | 2.0 /100 | #227 | Tragic 18.3% |
| Alaskan Athabascans | 2.0 /100 | #228 | Tragic 18.3% |
| Ghanaians | 1.4 /100 | #229 | Tragic 18.5% |
| Osage | 1.3 /100 | #230 | Tragic 18.5% |
| Cree | 1.3 /100 | #231 | Tragic 18.5% |
| Immigrants | Sudan | 1.1 /100 | #232 | Tragic 18.6% |
| Sudanese | 1.1 /100 | #233 | Tragic 18.6% |
| Fijians | 1.1 /100 | #234 | Tragic 18.6% |
| Nepalese | 1.1 /100 | #235 | Tragic 18.6% |
| Alsatians | 1.1 /100 | #236 | Tragic 18.6% |
| Immigrants | Nigeria | 1.0 /100 | #237 | Tragic 18.6% |