South American vs Immigrants from Ethiopia Child Poverty Among Girls Under 16
COMPARE
South American
Immigrants from Ethiopia
Child Poverty Among Girls Under 16
Child Poverty Among Girls Under 16 Comparison
South Americans
Immigrants from Ethiopia
16.1%
CHILD POVERTY AMONG GIRLS UNDER 16
67.2/ 100
METRIC RATING
166th/ 347
METRIC RANK
16.6%
CHILD POVERTY AMONG GIRLS UNDER 16
43.1/ 100
METRIC RATING
182nd/ 347
METRIC RANK
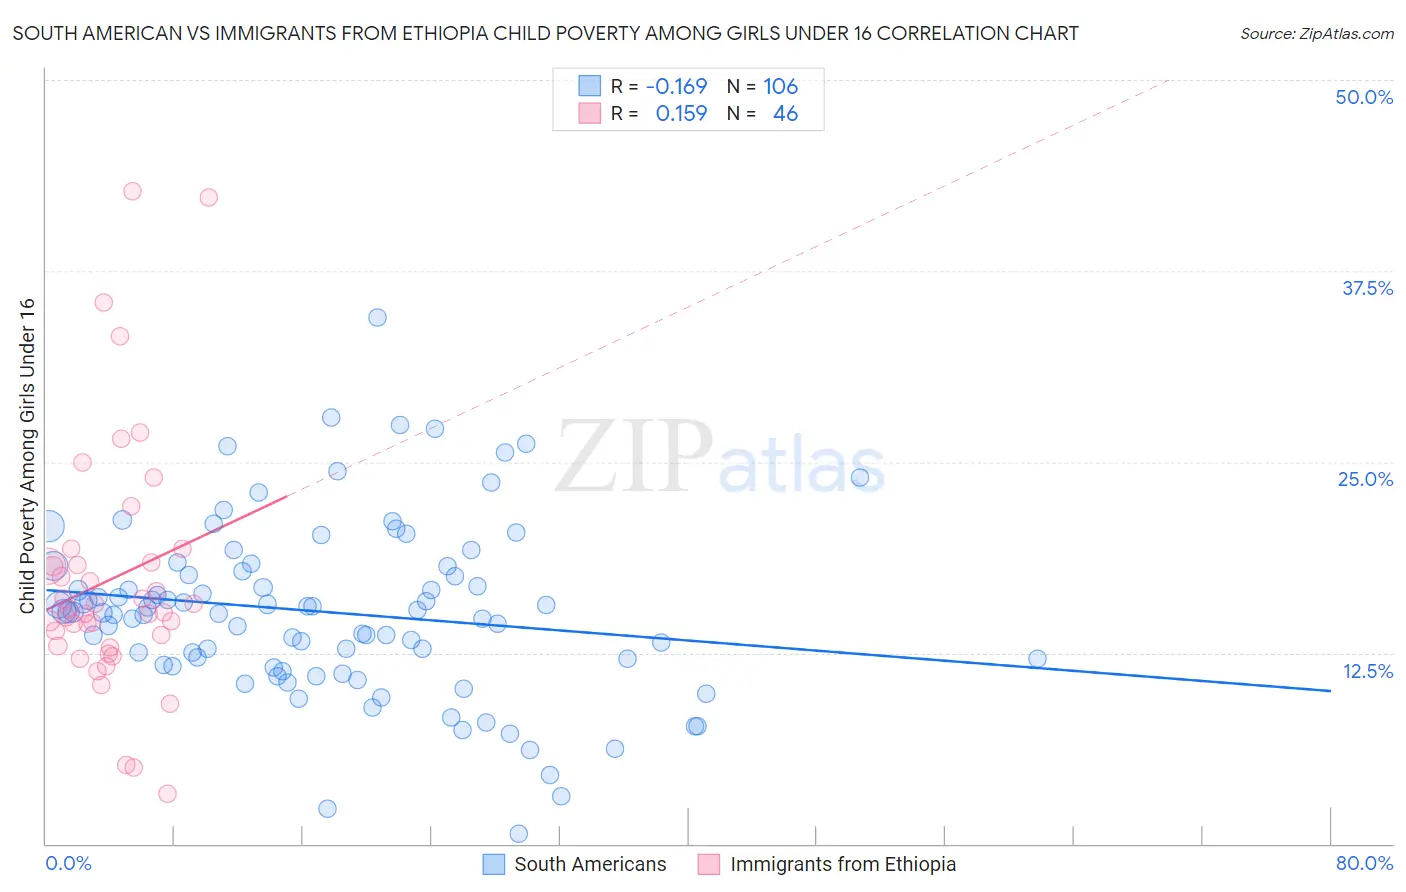
South American vs Immigrants from Ethiopia Child Poverty Among Girls Under 16 Correlation Chart
The statistical analysis conducted on geographies consisting of 481,449,574 people shows a poor negative correlation between the proportion of South Americans and poverty level among girls under the age of 16 in the United States with a correlation coefficient (R) of -0.169 and weighted average of 16.1%. Similarly, the statistical analysis conducted on geographies consisting of 209,782,942 people shows a poor positive correlation between the proportion of Immigrants from Ethiopia and poverty level among girls under the age of 16 in the United States with a correlation coefficient (R) of 0.159 and weighted average of 16.6%, a difference of 2.9%.
Child Poverty Among Girls Under 16 Correlation Summary
| Measurement | South American | Immigrants from Ethiopia |
| Minimum | 0.69% | 3.2% |
| Maximum | 34.5% | 42.7% |
| Range | 33.8% | 39.5% |
| Mean | 15.2% | 17.4% |
| Median | 15.1% | 15.3% |
| Interquartile 25% (IQ1) | 11.7% | 12.9% |
| Interquartile 75% (IQ3) | 17.9% | 18.4% |
| Interquartile Range (IQR) | 6.2% | 5.5% |
| Standard Deviation (Sample) | 5.7% | 8.2% |
| Standard Deviation (Population) | 5.7% | 8.2% |
Demographics Similar to South Americans and Immigrants from Ethiopia by Child Poverty Among Girls Under 16
In terms of child poverty among girls under 16, the demographic groups most similar to South Americans are Immigrants from Germany (16.1%, a difference of 0.020%), Immigrants from Colombia (16.1%, a difference of 0.090%), Uruguayan (16.2%, a difference of 0.32%), Yugoslavian (16.2%, a difference of 0.37%), and Costa Rican (16.2%, a difference of 0.38%). Similarly, the demographic groups most similar to Immigrants from Ethiopia are Immigrants from Iraq (16.6%, a difference of 0.010%), Immigrants from Syria (16.6%, a difference of 0.030%), Hawaiian (16.6%, a difference of 0.040%), White/Caucasian (16.6%, a difference of 0.070%), and Immigrants from Portugal (16.6%, a difference of 0.070%).
| Demographics | Rating | Rank | Child Poverty Among Girls Under 16 |
| Immigrants | Colombia | 67.8 /100 | #164 | Good 16.1% |
| Immigrants | Germany | 67.3 /100 | #165 | Good 16.1% |
| South Americans | 67.2 /100 | #166 | Good 16.1% |
| Uruguayans | 64.7 /100 | #167 | Good 16.2% |
| Yugoslavians | 64.4 /100 | #168 | Good 16.2% |
| Costa Ricans | 64.2 /100 | #169 | Good 16.2% |
| Immigrants | Venezuela | 64.2 /100 | #170 | Good 16.2% |
| Immigrants | Saudi Arabia | 64.0 /100 | #171 | Good 16.2% |
| Afghans | 62.3 /100 | #172 | Good 16.2% |
| Immigrants | South America | 55.1 /100 | #173 | Average 16.4% |
| Ethiopians | 50.0 /100 | #174 | Average 16.5% |
| Lebanese | 45.4 /100 | #175 | Average 16.6% |
| Hungarians | 45.1 /100 | #176 | Average 16.6% |
| Immigrants | Western Asia | 44.1 /100 | #177 | Average 16.6% |
| Whites/Caucasians | 43.6 /100 | #178 | Average 16.6% |
| Hawaiians | 43.4 /100 | #179 | Average 16.6% |
| Immigrants | Syria | 43.3 /100 | #180 | Average 16.6% |
| Immigrants | Iraq | 43.2 /100 | #181 | Average 16.6% |
| Immigrants | Ethiopia | 43.1 /100 | #182 | Average 16.6% |
| Immigrants | Portugal | 42.5 /100 | #183 | Average 16.6% |
| Scotch-Irish | 39.6 /100 | #184 | Fair 16.7% |