Somali vs Thai Single Female Poverty
COMPARE
Somali
Thai
Single Female Poverty
Single Female Poverty Comparison
Somalis
Thais
25.2%
SINGLE FEMALE POVERTY
0.0/ 100
METRIC RATING
303rd/ 347
METRIC RANK
17.3%
SINGLE FEMALE POVERTY
100.0/ 100
METRIC RATING
7th/ 347
METRIC RANK
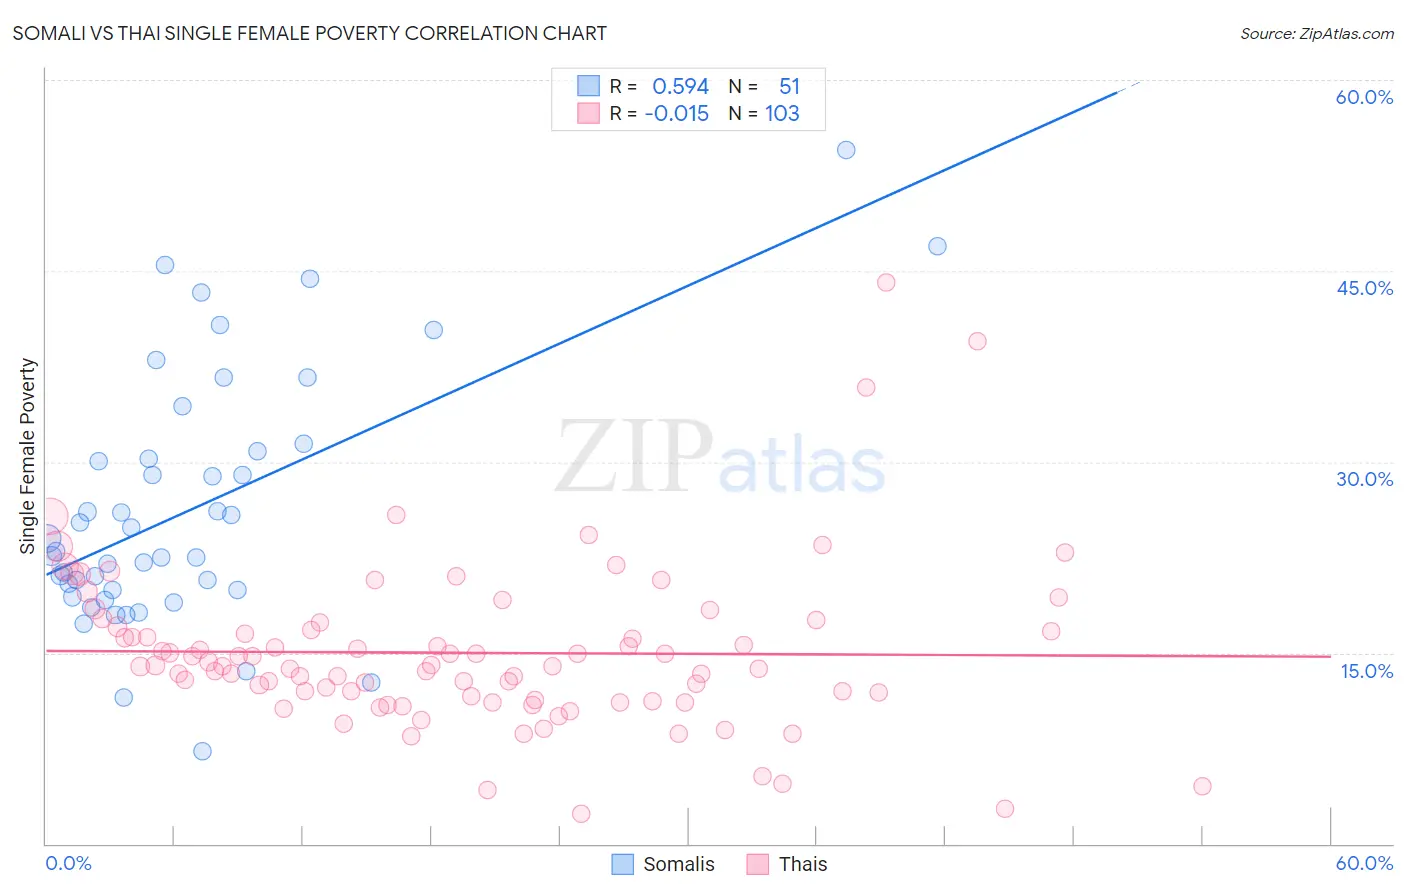
Somali vs Thai Single Female Poverty Correlation Chart
The statistical analysis conducted on geographies consisting of 99,025,014 people shows a substantial positive correlation between the proportion of Somalis and poverty level among single females in the United States with a correlation coefficient (R) of 0.594 and weighted average of 25.2%. Similarly, the statistical analysis conducted on geographies consisting of 465,874,007 people shows no correlation between the proportion of Thais and poverty level among single females in the United States with a correlation coefficient (R) of -0.015 and weighted average of 17.3%, a difference of 46.0%.
Single Female Poverty Correlation Summary
| Measurement | Somali | Thai |
| Minimum | 7.2% | 2.4% |
| Maximum | 54.5% | 44.0% |
| Range | 47.2% | 41.7% |
| Mean | 26.3% | 15.0% |
| Median | 23.0% | 13.9% |
| Interquartile 25% (IQ1) | 19.9% | 11.3% |
| Interquartile 75% (IQ3) | 30.8% | 17.1% |
| Interquartile Range (IQR) | 10.9% | 5.8% |
| Standard Deviation (Sample) | 9.9% | 6.4% |
| Standard Deviation (Population) | 9.8% | 6.4% |
Similar Demographics by Single Female Poverty
Demographics Similar to Somalis by Single Female Poverty
In terms of single female poverty, the demographic groups most similar to Somalis are Immigrants from Congo (25.3%, a difference of 0.27%), Immigrants from Dominican Republic (25.3%, a difference of 0.28%), Immigrants from Mexico (25.3%, a difference of 0.38%), Shoshone (25.1%, a difference of 0.40%), and Honduran (25.1%, a difference of 0.48%).
| Demographics | Rating | Rank | Single Female Poverty |
| Africans | 0.0 /100 | #296 | Tragic 24.8% |
| Immigrants | Central America | 0.0 /100 | #297 | Tragic 24.8% |
| Yaqui | 0.0 /100 | #298 | Tragic 24.9% |
| Mexicans | 0.0 /100 | #299 | Tragic 25.0% |
| Blackfeet | 0.0 /100 | #300 | Tragic 25.1% |
| Hondurans | 0.0 /100 | #301 | Tragic 25.1% |
| Shoshone | 0.0 /100 | #302 | Tragic 25.1% |
| Somalis | 0.0 /100 | #303 | Tragic 25.2% |
| Immigrants | Congo | 0.0 /100 | #304 | Tragic 25.3% |
| Immigrants | Dominican Republic | 0.0 /100 | #305 | Tragic 25.3% |
| Immigrants | Mexico | 0.0 /100 | #306 | Tragic 25.3% |
| Potawatomi | 0.0 /100 | #307 | Tragic 25.4% |
| Aleuts | 0.0 /100 | #308 | Tragic 25.4% |
| Dominicans | 0.0 /100 | #309 | Tragic 25.4% |
| Central American Indians | 0.0 /100 | #310 | Tragic 25.5% |
Demographics Similar to Thais by Single Female Poverty
In terms of single female poverty, the demographic groups most similar to Thais are Immigrants from Iran (17.5%, a difference of 0.99%), Filipino (17.0%, a difference of 1.7%), Assyrian/Chaldean/Syriac (17.0%, a difference of 1.9%), Bhutanese (17.7%, a difference of 2.4%), and Immigrants from India (16.8%, a difference of 2.8%).
| Demographics | Rating | Rank | Single Female Poverty |
| Chinese | 100.0 /100 | #1 | Exceptional 16.1% |
| Immigrants | Taiwan | 100.0 /100 | #2 | Exceptional 16.4% |
| Immigrants | Hong Kong | 100.0 /100 | #3 | Exceptional 16.5% |
| Immigrants | India | 100.0 /100 | #4 | Exceptional 16.8% |
| Assyrians/Chaldeans/Syriacs | 100.0 /100 | #5 | Exceptional 17.0% |
| Filipinos | 100.0 /100 | #6 | Exceptional 17.0% |
| Thais | 100.0 /100 | #7 | Exceptional 17.3% |
| Immigrants | Iran | 100.0 /100 | #8 | Exceptional 17.5% |
| Bhutanese | 100.0 /100 | #9 | Exceptional 17.7% |
| Immigrants | Ireland | 100.0 /100 | #10 | Exceptional 17.8% |
| Immigrants | Lithuania | 100.0 /100 | #11 | Exceptional 17.8% |
| Immigrants | South Central Asia | 100.0 /100 | #12 | Exceptional 17.8% |
| Immigrants | Bolivia | 100.0 /100 | #13 | Exceptional 17.8% |
| Bolivians | 100.0 /100 | #14 | Exceptional 17.9% |
| Indians (Asian) | 100.0 /100 | #15 | Exceptional 17.9% |