Menominee vs Lumbee Receiving Food Stamps
COMPARE
Menominee
Lumbee
Receiving Food Stamps
Receiving Food Stamps Comparison
Menominee
Lumbee
17.2%
RECEIVING FOOD STAMPS
0.0/ 100
METRIC RATING
318th/ 347
METRIC RANK
22.9%
RECEIVING FOOD STAMPS
0.0/ 100
METRIC RATING
344th/ 347
METRIC RANK
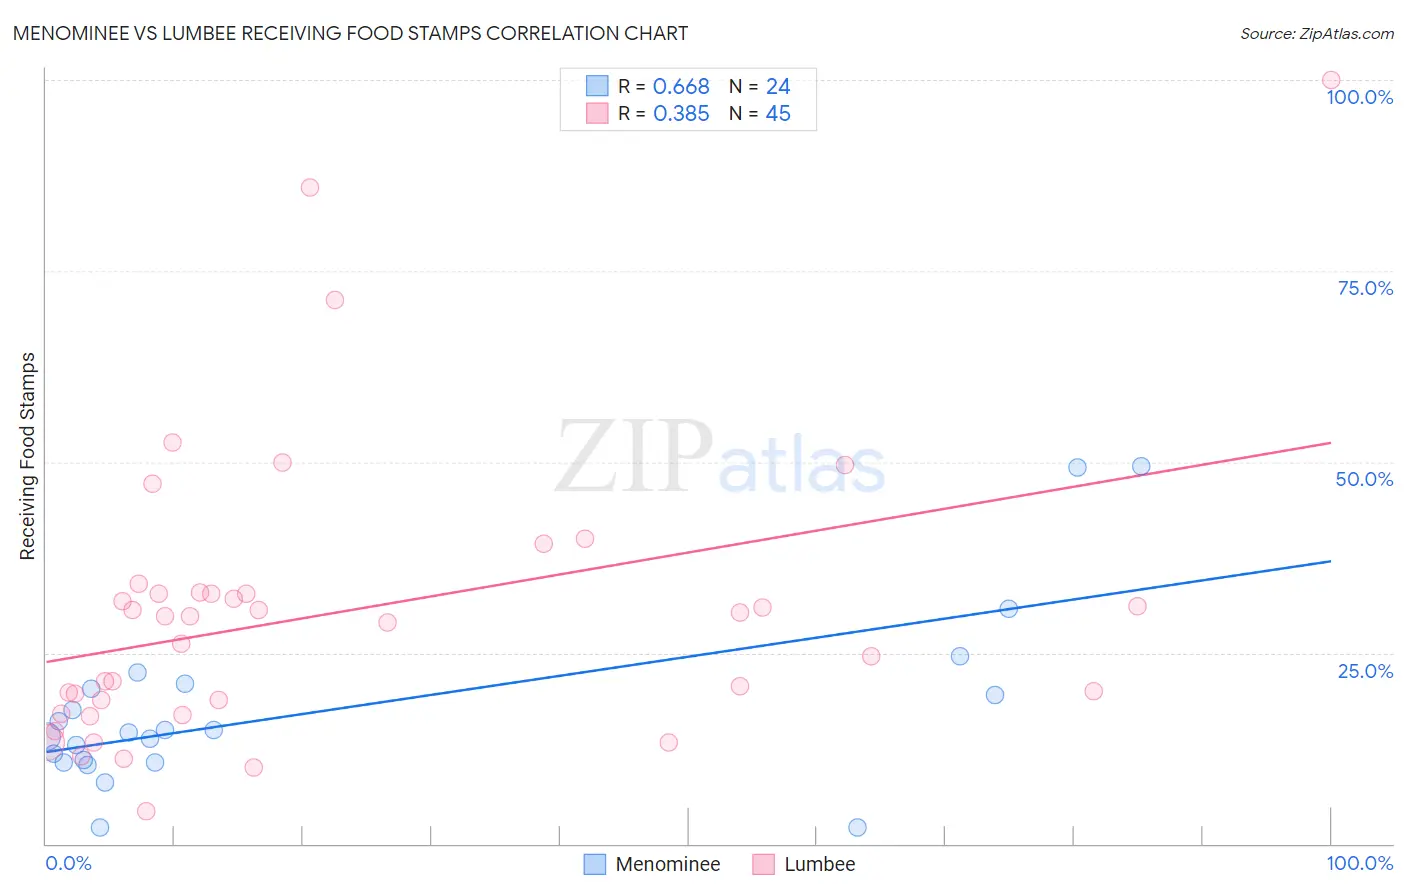
Menominee vs Lumbee Receiving Food Stamps Correlation Chart
The statistical analysis conducted on geographies consisting of 45,777,260 people shows a significant positive correlation between the proportion of Menominee and percentage of population receiving government assistance and/or food stamps in the United States with a correlation coefficient (R) of 0.668 and weighted average of 17.2%. Similarly, the statistical analysis conducted on geographies consisting of 92,196,215 people shows a mild positive correlation between the proportion of Lumbee and percentage of population receiving government assistance and/or food stamps in the United States with a correlation coefficient (R) of 0.385 and weighted average of 22.9%, a difference of 33.2%.
Receiving Food Stamps Correlation Summary
| Measurement | Menominee | Lumbee |
| Minimum | 2.1% | 4.2% |
| Maximum | 49.4% | 100.0% |
| Range | 47.3% | 95.8% |
| Mean | 17.6% | 30.2% |
| Median | 14.7% | 29.7% |
| Interquartile 25% (IQ1) | 10.8% | 17.9% |
| Interquartile 75% (IQ3) | 20.7% | 32.8% |
| Interquartile Range (IQR) | 9.9% | 14.9% |
| Standard Deviation (Sample) | 11.7% | 18.9% |
| Standard Deviation (Population) | 11.4% | 18.7% |
Similar Demographics by Receiving Food Stamps
Demographics Similar to Menominee by Receiving Food Stamps
In terms of receiving food stamps, the demographic groups most similar to Menominee are Black/African American (17.2%, a difference of 0.17%), Immigrants from St. Vincent and the Grenadines (17.2%, a difference of 0.18%), Immigrants from Nicaragua (17.2%, a difference of 0.26%), Native/Alaskan (17.3%, a difference of 0.44%), and Central American Indian (17.1%, a difference of 0.70%).
| Demographics | Rating | Rank | Receiving Food Stamps |
| Guyanese | 0.0 /100 | #311 | Tragic 16.7% |
| Sioux | 0.0 /100 | #312 | Tragic 16.8% |
| Immigrants | Jamaica | 0.0 /100 | #313 | Tragic 16.9% |
| Immigrants | Guyana | 0.0 /100 | #314 | Tragic 16.9% |
| Bahamians | 0.0 /100 | #315 | Tragic 17.0% |
| Central American Indians | 0.0 /100 | #316 | Tragic 17.1% |
| Blacks/African Americans | 0.0 /100 | #317 | Tragic 17.2% |
| Menominee | 0.0 /100 | #318 | Tragic 17.2% |
| Immigrants | St. Vincent and the Grenadines | 0.0 /100 | #319 | Tragic 17.2% |
| Immigrants | Nicaragua | 0.0 /100 | #320 | Tragic 17.2% |
| Natives/Alaskans | 0.0 /100 | #321 | Tragic 17.3% |
| Immigrants | Grenada | 0.0 /100 | #322 | Tragic 17.8% |
| Haitians | 0.0 /100 | #323 | Tragic 17.8% |
| British West Indians | 0.0 /100 | #324 | Tragic 17.9% |
| Immigrants | Haiti | 0.0 /100 | #325 | Tragic 18.2% |
Demographics Similar to Lumbee by Receiving Food Stamps
In terms of receiving food stamps, the demographic groups most similar to Lumbee are Immigrants from Dominican Republic (22.1%, a difference of 3.6%), Immigrants from Cabo Verde (23.8%, a difference of 4.1%), Immigrants from Yemen (21.6%, a difference of 5.9%), Hopi (21.6%, a difference of 6.3%), and Tohono O'odham (21.5%, a difference of 6.7%).
| Demographics | Rating | Rank | Receiving Food Stamps |
| Inupiat | 0.0 /100 | #333 | Tragic 20.1% |
| Yuman | 0.0 /100 | #334 | Tragic 20.2% |
| Immigrants | Cuba | 0.0 /100 | #335 | Tragic 20.8% |
| Navajo | 0.0 /100 | #336 | Tragic 21.1% |
| Cape Verdeans | 0.0 /100 | #337 | Tragic 21.1% |
| Dominicans | 0.0 /100 | #338 | Tragic 21.4% |
| Yakama | 0.0 /100 | #339 | Tragic 21.4% |
| Tohono O'odham | 0.0 /100 | #340 | Tragic 21.5% |
| Hopi | 0.0 /100 | #341 | Tragic 21.6% |
| Immigrants | Yemen | 0.0 /100 | #342 | Tragic 21.6% |
| Immigrants | Dominican Republic | 0.0 /100 | #343 | Tragic 22.1% |
| Lumbee | 0.0 /100 | #344 | Tragic 22.9% |
| Immigrants | Cabo Verde | 0.0 /100 | #345 | Tragic 23.8% |
| Puerto Ricans | 0.0 /100 | #346 | Tragic 26.0% |
| Yup'ik | 0.0 /100 | #347 | Tragic 32.7% |