Somali vs Welsh Receiving Food Stamps
COMPARE
Somali
Welsh
Receiving Food Stamps
Receiving Food Stamps Comparison
Somalis
Welsh
13.7%
RECEIVING FOOD STAMPS
0.9/ 100
METRIC RATING
243rd/ 347
METRIC RANK
10.3%
RECEIVING FOOD STAMPS
97.3/ 100
METRIC RATING
96th/ 347
METRIC RANK
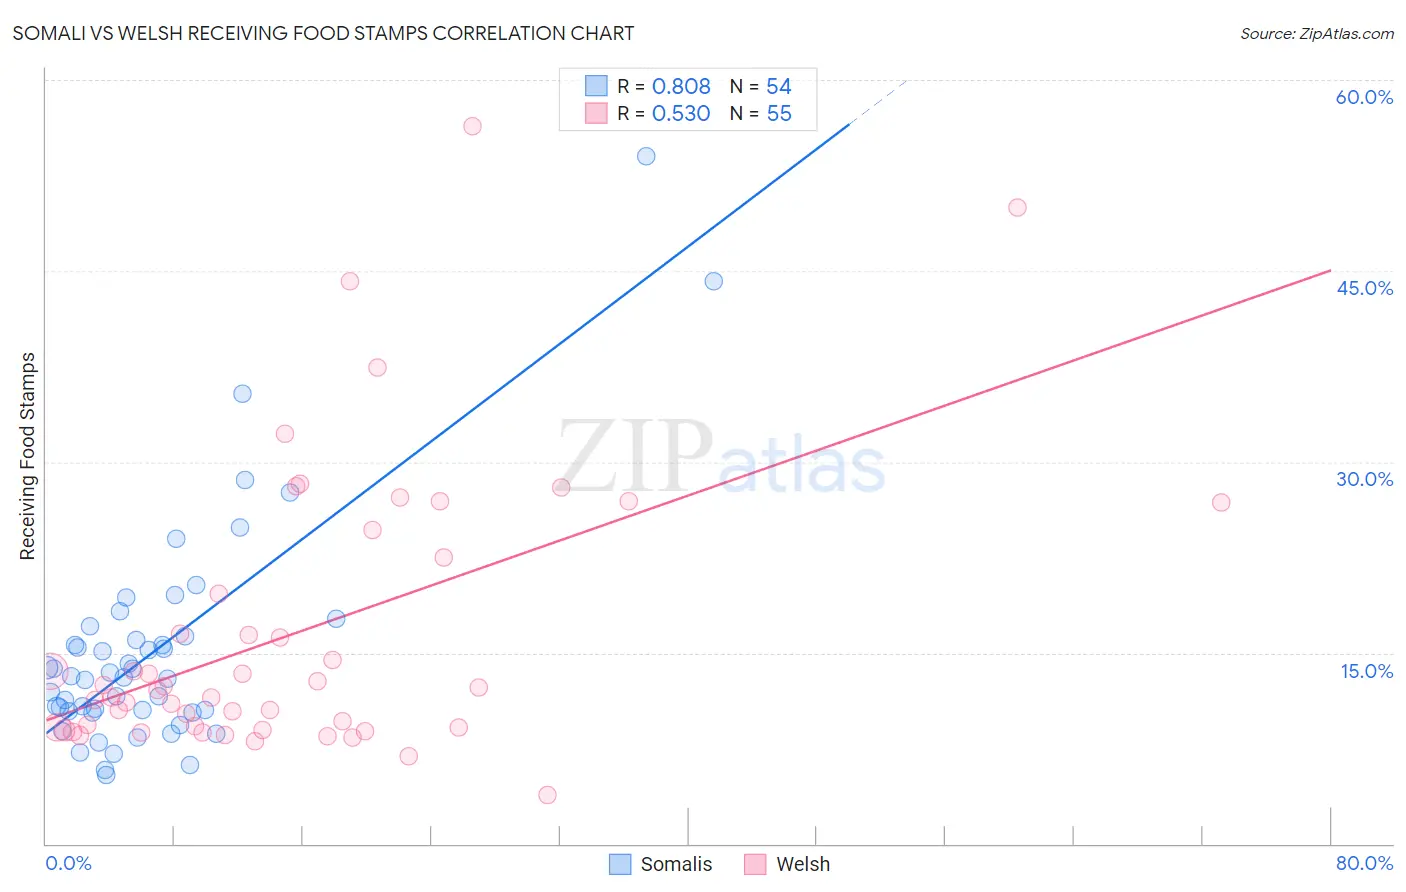
Somali vs Welsh Receiving Food Stamps Correlation Chart
The statistical analysis conducted on geographies consisting of 99,256,962 people shows a very strong positive correlation between the proportion of Somalis and percentage of population receiving government assistance and/or food stamps in the United States with a correlation coefficient (R) of 0.808 and weighted average of 13.7%. Similarly, the statistical analysis conducted on geographies consisting of 526,059,303 people shows a substantial positive correlation between the proportion of Welsh and percentage of population receiving government assistance and/or food stamps in the United States with a correlation coefficient (R) of 0.530 and weighted average of 10.3%, a difference of 33.1%.
Receiving Food Stamps Correlation Summary
| Measurement | Somali | Welsh |
| Minimum | 5.4% | 3.8% |
| Maximum | 54.0% | 56.4% |
| Range | 48.6% | 52.6% |
| Mean | 15.2% | 16.5% |
| Median | 13.1% | 12.1% |
| Interquartile 25% (IQ1) | 10.4% | 9.1% |
| Interquartile 75% (IQ3) | 16.3% | 22.5% |
| Interquartile Range (IQR) | 5.9% | 13.4% |
| Standard Deviation (Sample) | 9.0% | 11.2% |
| Standard Deviation (Population) | 8.9% | 11.1% |
Similar Demographics by Receiving Food Stamps
Demographics Similar to Somalis by Receiving Food Stamps
In terms of receiving food stamps, the demographic groups most similar to Somalis are Cajun (13.7%, a difference of 0.16%), Immigrants from Panama (13.6%, a difference of 0.19%), Immigrants from Somalia (13.7%, a difference of 0.20%), Choctaw (13.6%, a difference of 0.38%), and Cree (13.7%, a difference of 0.44%).
| Demographics | Rating | Rank | Receiving Food Stamps |
| Crow | 1.6 /100 | #236 | Tragic 13.4% |
| Immigrants | El Salvador | 1.5 /100 | #237 | Tragic 13.5% |
| French American Indians | 1.4 /100 | #238 | Tragic 13.5% |
| Immigrants | Micronesia | 1.3 /100 | #239 | Tragic 13.5% |
| Iroquois | 1.2 /100 | #240 | Tragic 13.5% |
| Choctaw | 1.0 /100 | #241 | Tragic 13.6% |
| Immigrants | Panama | 1.0 /100 | #242 | Tragic 13.6% |
| Somalis | 0.9 /100 | #243 | Tragic 13.7% |
| Cajuns | 0.9 /100 | #244 | Tragic 13.7% |
| Immigrants | Somalia | 0.9 /100 | #245 | Tragic 13.7% |
| Cree | 0.8 /100 | #246 | Tragic 13.7% |
| Mexican American Indians | 0.7 /100 | #247 | Tragic 13.8% |
| Immigrants | Laos | 0.7 /100 | #248 | Tragic 13.8% |
| Indonesians | 0.6 /100 | #249 | Tragic 13.9% |
| Immigrants | Cambodia | 0.5 /100 | #250 | Tragic 13.9% |
Demographics Similar to Welsh by Receiving Food Stamps
In terms of receiving food stamps, the demographic groups most similar to Welsh are Basque (10.3%, a difference of 0.050%), Immigrants from Greece (10.3%, a difference of 0.080%), Czechoslovakian (10.3%, a difference of 0.26%), Immigrants from Egypt (10.3%, a difference of 0.31%), and Serbian (10.3%, a difference of 0.49%).
| Demographics | Rating | Rank | Receiving Food Stamps |
| Immigrants | France | 98.3 /100 | #89 | Exceptional 10.1% |
| Finns | 97.9 /100 | #90 | Exceptional 10.2% |
| Jordanians | 97.9 /100 | #91 | Exceptional 10.2% |
| Irish | 97.9 /100 | #92 | Exceptional 10.2% |
| Belgians | 97.7 /100 | #93 | Exceptional 10.2% |
| Immigrants | Greece | 97.4 /100 | #94 | Exceptional 10.3% |
| Basques | 97.4 /100 | #95 | Exceptional 10.3% |
| Welsh | 97.3 /100 | #96 | Exceptional 10.3% |
| Czechoslovakians | 97.2 /100 | #97 | Exceptional 10.3% |
| Immigrants | Egypt | 97.1 /100 | #98 | Exceptional 10.3% |
| Serbians | 97.0 /100 | #99 | Exceptional 10.3% |
| Immigrants | Western Europe | 96.9 /100 | #100 | Exceptional 10.3% |
| Palestinians | 96.9 /100 | #101 | Exceptional 10.3% |
| Immigrants | Europe | 96.8 /100 | #102 | Exceptional 10.3% |
| Immigrants | Latvia | 96.8 /100 | #103 | Exceptional 10.3% |