Immigrants from Singapore vs Lumbee Receiving Food Stamps
COMPARE
Immigrants from Singapore
Lumbee
Receiving Food Stamps
Receiving Food Stamps Comparison
Immigrants from Singapore
Lumbee
8.3%
RECEIVING FOOD STAMPS
100.0/ 100
METRIC RATING
6th/ 347
METRIC RANK
22.9%
RECEIVING FOOD STAMPS
0.0/ 100
METRIC RATING
344th/ 347
METRIC RANK
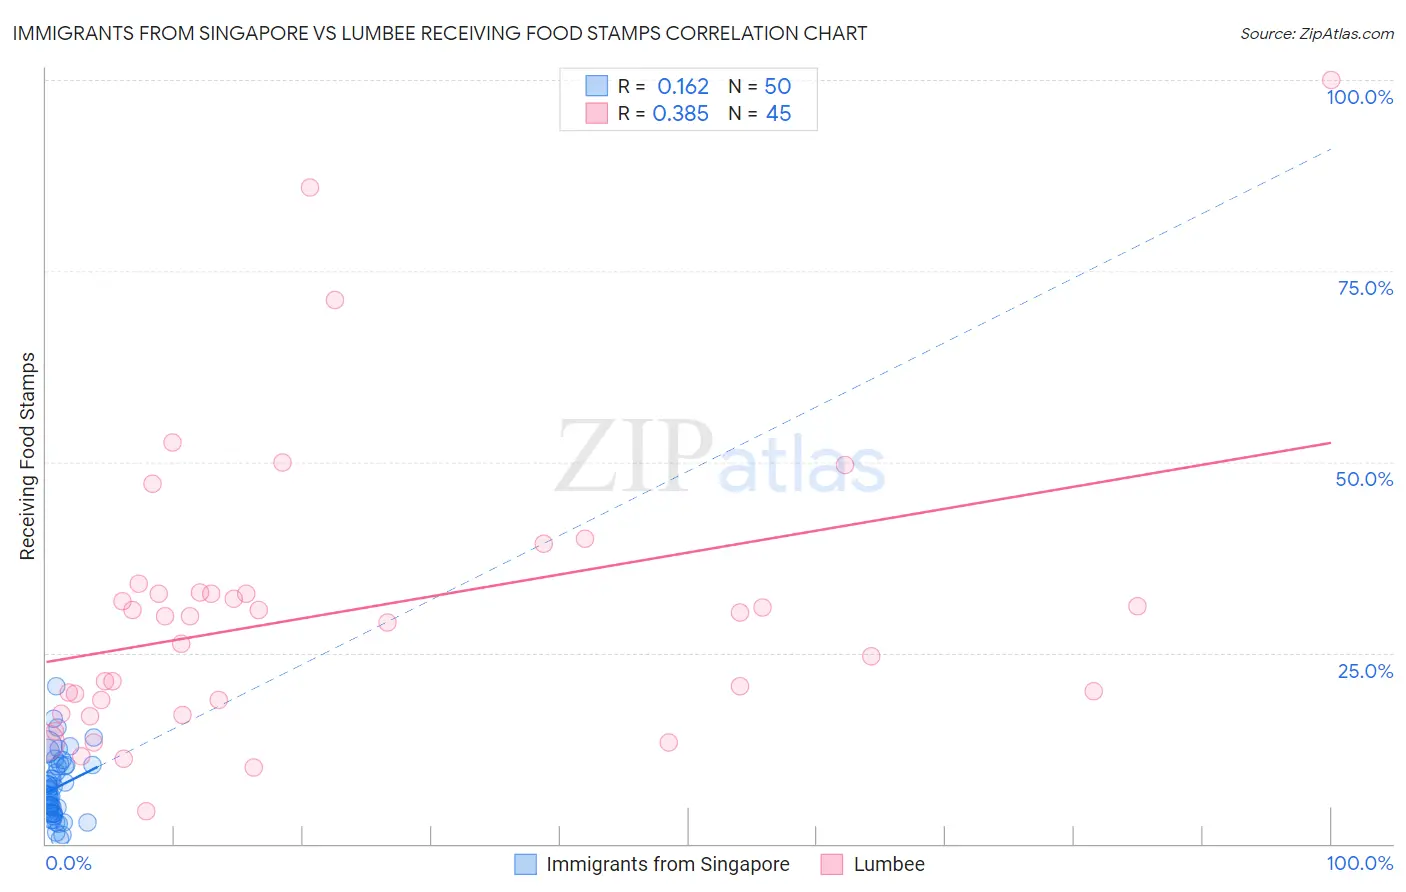
Immigrants from Singapore vs Lumbee Receiving Food Stamps Correlation Chart
The statistical analysis conducted on geographies consisting of 137,241,219 people shows a poor positive correlation between the proportion of Immigrants from Singapore and percentage of population receiving government assistance and/or food stamps in the United States with a correlation coefficient (R) of 0.162 and weighted average of 8.3%. Similarly, the statistical analysis conducted on geographies consisting of 92,196,215 people shows a mild positive correlation between the proportion of Lumbee and percentage of population receiving government assistance and/or food stamps in the United States with a correlation coefficient (R) of 0.385 and weighted average of 22.9%, a difference of 176.0%.
Receiving Food Stamps Correlation Summary
| Measurement | Immigrants from Singapore | Lumbee |
| Minimum | 0.70% | 4.2% |
| Maximum | 20.7% | 100.0% |
| Range | 20.0% | 95.8% |
| Mean | 7.4% | 30.2% |
| Median | 6.7% | 29.7% |
| Interquartile 25% (IQ1) | 3.9% | 17.9% |
| Interquartile 75% (IQ3) | 10.3% | 32.8% |
| Interquartile Range (IQR) | 6.4% | 14.9% |
| Standard Deviation (Sample) | 4.3% | 18.9% |
| Standard Deviation (Population) | 4.2% | 18.7% |
Similar Demographics by Receiving Food Stamps
Demographics Similar to Immigrants from Singapore by Receiving Food Stamps
In terms of receiving food stamps, the demographic groups most similar to Immigrants from Singapore are Immigrants from Iran (8.3%, a difference of 0.56%), Thai (8.1%, a difference of 2.3%), Burmese (8.6%, a difference of 4.2%), Immigrants from Korea (8.7%, a difference of 4.4%), and Iranian (7.9%, a difference of 4.6%).
| Demographics | Rating | Rank | Receiving Food Stamps |
| Immigrants | Taiwan | 100.0 /100 | #1 | Exceptional 7.3% |
| Immigrants | India | 100.0 /100 | #2 | Exceptional 7.4% |
| Filipinos | 100.0 /100 | #3 | Exceptional 7.4% |
| Iranians | 100.0 /100 | #4 | Exceptional 7.9% |
| Thais | 100.0 /100 | #5 | Exceptional 8.1% |
| Immigrants | Singapore | 100.0 /100 | #6 | Exceptional 8.3% |
| Immigrants | Iran | 100.0 /100 | #7 | Exceptional 8.3% |
| Burmese | 99.9 /100 | #8 | Exceptional 8.6% |
| Immigrants | Korea | 99.9 /100 | #9 | Exceptional 8.7% |
| Immigrants | South Central Asia | 99.9 /100 | #10 | Exceptional 8.8% |
| Okinawans | 99.9 /100 | #11 | Exceptional 8.9% |
| Cypriots | 99.9 /100 | #12 | Exceptional 8.9% |
| Bulgarians | 99.9 /100 | #13 | Exceptional 8.9% |
| Maltese | 99.9 /100 | #14 | Exceptional 8.9% |
| Norwegians | 99.9 /100 | #15 | Exceptional 9.0% |
Demographics Similar to Lumbee by Receiving Food Stamps
In terms of receiving food stamps, the demographic groups most similar to Lumbee are Immigrants from Dominican Republic (22.1%, a difference of 3.6%), Immigrants from Cabo Verde (23.8%, a difference of 4.1%), Immigrants from Yemen (21.6%, a difference of 5.9%), Hopi (21.6%, a difference of 6.3%), and Tohono O'odham (21.5%, a difference of 6.7%).
| Demographics | Rating | Rank | Receiving Food Stamps |
| Inupiat | 0.0 /100 | #333 | Tragic 20.1% |
| Yuman | 0.0 /100 | #334 | Tragic 20.2% |
| Immigrants | Cuba | 0.0 /100 | #335 | Tragic 20.8% |
| Navajo | 0.0 /100 | #336 | Tragic 21.1% |
| Cape Verdeans | 0.0 /100 | #337 | Tragic 21.1% |
| Dominicans | 0.0 /100 | #338 | Tragic 21.4% |
| Yakama | 0.0 /100 | #339 | Tragic 21.4% |
| Tohono O'odham | 0.0 /100 | #340 | Tragic 21.5% |
| Hopi | 0.0 /100 | #341 | Tragic 21.6% |
| Immigrants | Yemen | 0.0 /100 | #342 | Tragic 21.6% |
| Immigrants | Dominican Republic | 0.0 /100 | #343 | Tragic 22.1% |
| Lumbee | 0.0 /100 | #344 | Tragic 22.9% |
| Immigrants | Cabo Verde | 0.0 /100 | #345 | Tragic 23.8% |
| Puerto Ricans | 0.0 /100 | #346 | Tragic 26.0% |
| Yup'ik | 0.0 /100 | #347 | Tragic 32.7% |