Immigrants from Eritrea vs Lumbee Receiving Food Stamps
COMPARE
Immigrants from Eritrea
Lumbee
Receiving Food Stamps
Receiving Food Stamps Comparison
Immigrants from Eritrea
Lumbee
11.7%
RECEIVING FOOD STAMPS
50.0/ 100
METRIC RATING
174th/ 347
METRIC RANK
22.9%
RECEIVING FOOD STAMPS
0.0/ 100
METRIC RATING
344th/ 347
METRIC RANK
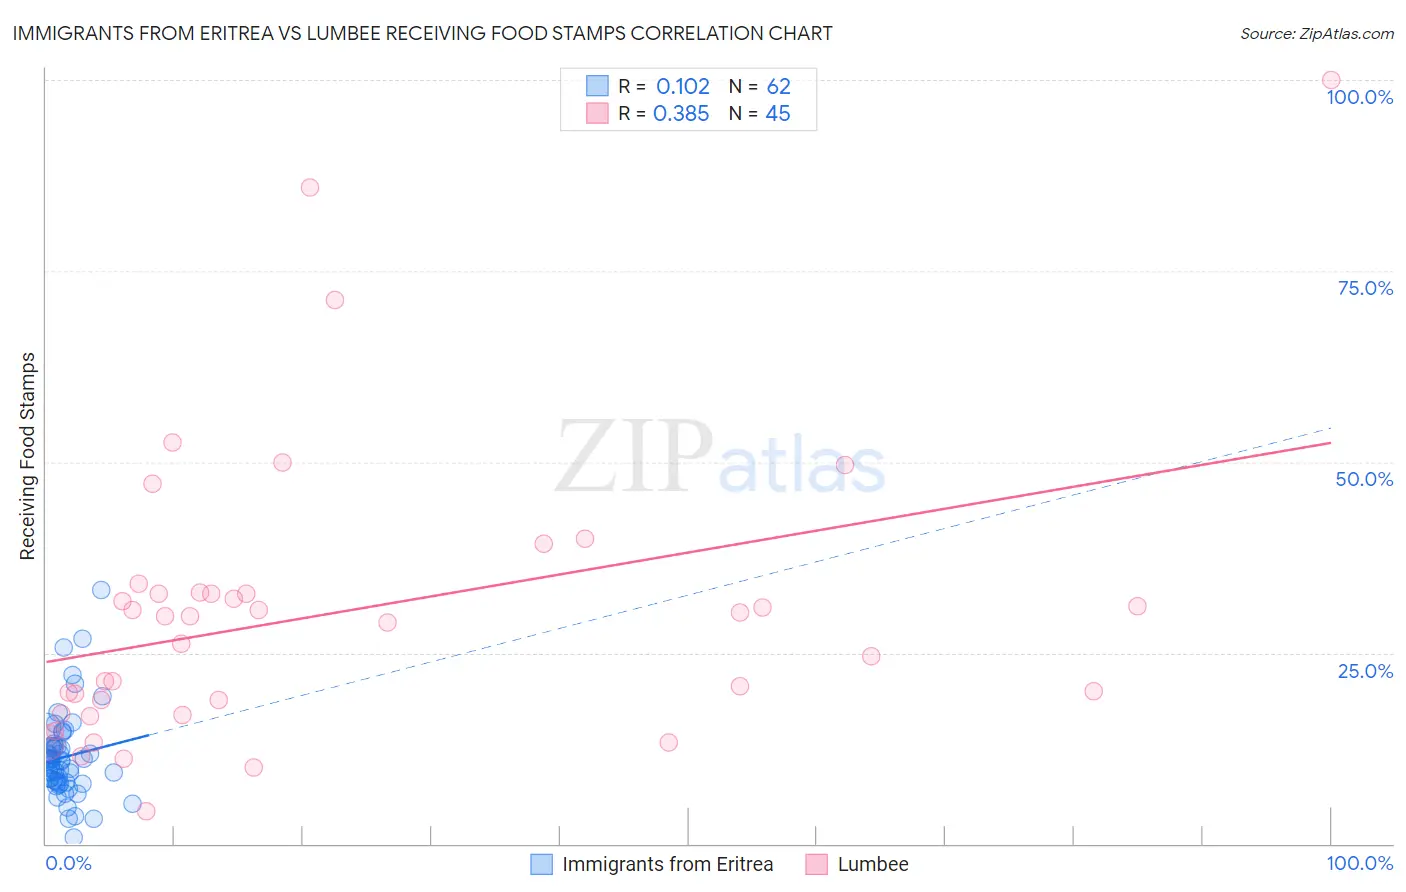
Immigrants from Eritrea vs Lumbee Receiving Food Stamps Correlation Chart
The statistical analysis conducted on geographies consisting of 104,840,679 people shows a poor positive correlation between the proportion of Immigrants from Eritrea and percentage of population receiving government assistance and/or food stamps in the United States with a correlation coefficient (R) of 0.102 and weighted average of 11.7%. Similarly, the statistical analysis conducted on geographies consisting of 92,196,215 people shows a mild positive correlation between the proportion of Lumbee and percentage of population receiving government assistance and/or food stamps in the United States with a correlation coefficient (R) of 0.385 and weighted average of 22.9%, a difference of 95.2%.
Receiving Food Stamps Correlation Summary
| Measurement | Immigrants from Eritrea | Lumbee |
| Minimum | 0.80% | 4.2% |
| Maximum | 33.3% | 100.0% |
| Range | 32.5% | 95.8% |
| Mean | 11.4% | 30.2% |
| Median | 10.9% | 29.7% |
| Interquartile 25% (IQ1) | 8.1% | 17.9% |
| Interquartile 75% (IQ3) | 12.8% | 32.8% |
| Interquartile Range (IQR) | 4.7% | 14.9% |
| Standard Deviation (Sample) | 5.7% | 18.9% |
| Standard Deviation (Population) | 5.6% | 18.7% |
Similar Demographics by Receiving Food Stamps
Demographics Similar to Immigrants from Eritrea by Receiving Food Stamps
In terms of receiving food stamps, the demographic groups most similar to Immigrants from Eritrea are Osage (11.7%, a difference of 0.020%), Peruvian (11.7%, a difference of 0.10%), Immigrants from Ukraine (11.8%, a difference of 0.23%), German Russian (11.8%, a difference of 0.26%), and Immigrants from Syria (11.7%, a difference of 0.48%).
| Demographics | Rating | Rank | Receiving Food Stamps |
| Kenyans | 60.2 /100 | #167 | Good 11.6% |
| Tlingit-Haida | 59.1 /100 | #168 | Average 11.6% |
| Immigrants | Eastern Africa | 58.3 /100 | #169 | Average 11.6% |
| Costa Ricans | 57.9 /100 | #170 | Average 11.6% |
| Immigrants | Western Asia | 56.4 /100 | #171 | Average 11.6% |
| Guamanians/Chamorros | 54.2 /100 | #172 | Average 11.7% |
| Immigrants | Syria | 53.4 /100 | #173 | Average 11.7% |
| Immigrants | Eritrea | 50.0 /100 | #174 | Average 11.7% |
| Osage | 49.8 /100 | #175 | Average 11.7% |
| Peruvians | 49.3 /100 | #176 | Average 11.7% |
| Immigrants | Ukraine | 48.4 /100 | #177 | Average 11.8% |
| German Russians | 48.1 /100 | #178 | Average 11.8% |
| Immigrants | Kenya | 46.4 /100 | #179 | Average 11.8% |
| Uruguayans | 44.8 /100 | #180 | Average 11.8% |
| South American Indians | 41.7 /100 | #181 | Average 11.9% |
Demographics Similar to Lumbee by Receiving Food Stamps
In terms of receiving food stamps, the demographic groups most similar to Lumbee are Immigrants from Dominican Republic (22.1%, a difference of 3.6%), Immigrants from Cabo Verde (23.8%, a difference of 4.1%), Immigrants from Yemen (21.6%, a difference of 5.9%), Hopi (21.6%, a difference of 6.3%), and Tohono O'odham (21.5%, a difference of 6.7%).
| Demographics | Rating | Rank | Receiving Food Stamps |
| Inupiat | 0.0 /100 | #333 | Tragic 20.1% |
| Yuman | 0.0 /100 | #334 | Tragic 20.2% |
| Immigrants | Cuba | 0.0 /100 | #335 | Tragic 20.8% |
| Navajo | 0.0 /100 | #336 | Tragic 21.1% |
| Cape Verdeans | 0.0 /100 | #337 | Tragic 21.1% |
| Dominicans | 0.0 /100 | #338 | Tragic 21.4% |
| Yakama | 0.0 /100 | #339 | Tragic 21.4% |
| Tohono O'odham | 0.0 /100 | #340 | Tragic 21.5% |
| Hopi | 0.0 /100 | #341 | Tragic 21.6% |
| Immigrants | Yemen | 0.0 /100 | #342 | Tragic 21.6% |
| Immigrants | Dominican Republic | 0.0 /100 | #343 | Tragic 22.1% |
| Lumbee | 0.0 /100 | #344 | Tragic 22.9% |
| Immigrants | Cabo Verde | 0.0 /100 | #345 | Tragic 23.8% |
| Puerto Ricans | 0.0 /100 | #346 | Tragic 26.0% |
| Yup'ik | 0.0 /100 | #347 | Tragic 32.7% |