Immigrants from Mexico vs Ugandan Single Male Poverty
COMPARE
Immigrants from Mexico
Ugandan
Single Male Poverty
Single Male Poverty Comparison
Immigrants from Mexico
Ugandans
13.9%
SINGLE MALE POVERTY
0.1/ 100
METRIC RATING
268th/ 347
METRIC RANK
12.3%
SINGLE MALE POVERTY
94.5/ 100
METRIC RATING
109th/ 347
METRIC RANK
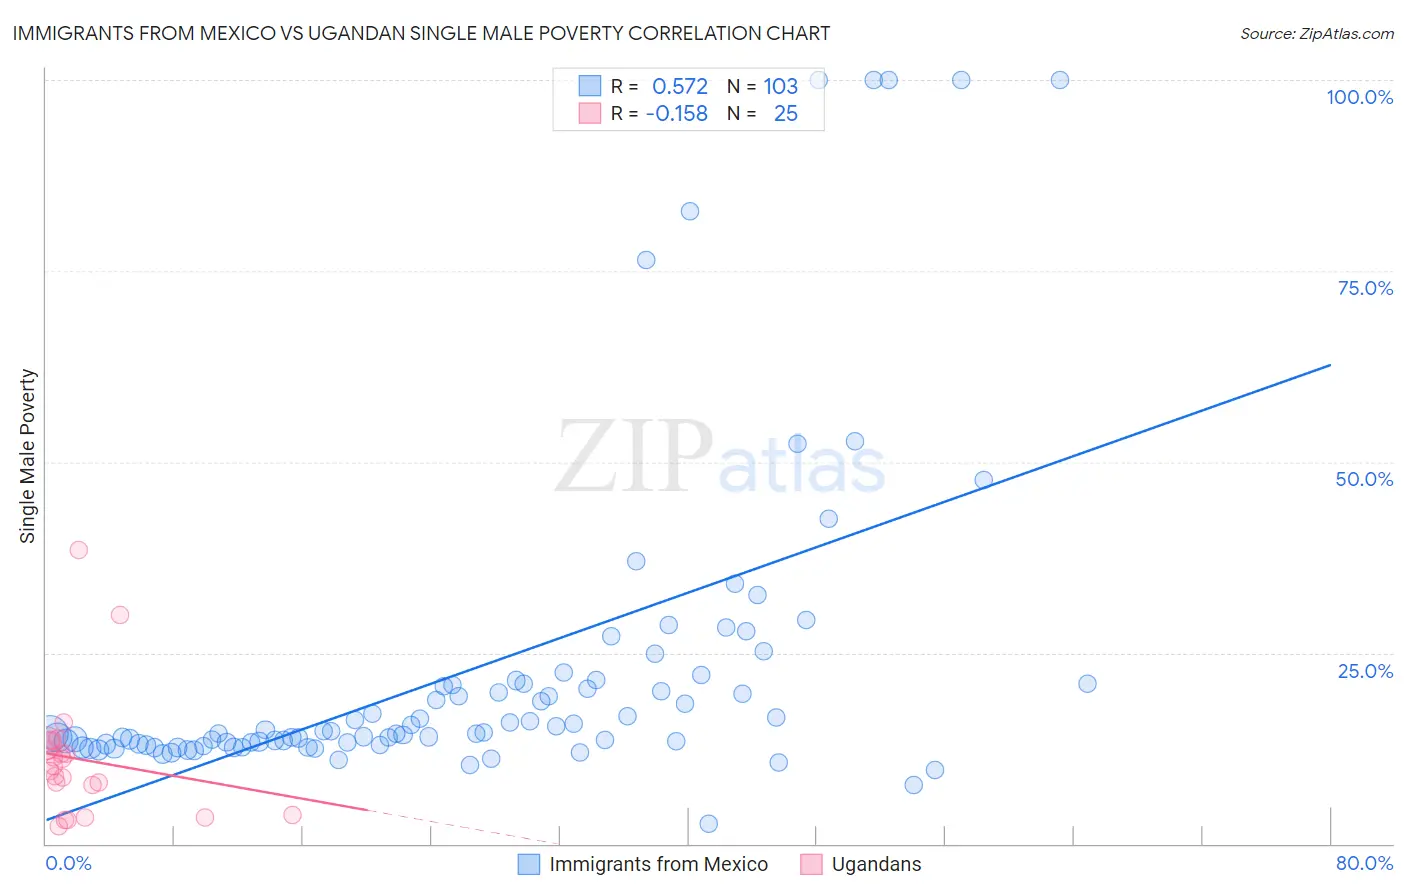
Immigrants from Mexico vs Ugandan Single Male Poverty Correlation Chart
The statistical analysis conducted on geographies consisting of 441,273,873 people shows a substantial positive correlation between the proportion of Immigrants from Mexico and poverty level among single males in the United States with a correlation coefficient (R) of 0.572 and weighted average of 13.9%. Similarly, the statistical analysis conducted on geographies consisting of 90,762,990 people shows a poor negative correlation between the proportion of Ugandans and poverty level among single males in the United States with a correlation coefficient (R) of -0.158 and weighted average of 12.3%, a difference of 13.2%.
Single Male Poverty Correlation Summary
| Measurement | Immigrants from Mexico | Ugandan |
| Minimum | 2.6% | 2.3% |
| Maximum | 100.0% | 38.5% |
| Range | 97.4% | 36.1% |
| Mean | 22.9% | 11.1% |
| Median | 14.5% | 10.2% |
| Interquartile 25% (IQ1) | 13.0% | 5.7% |
| Interquartile 75% (IQ3) | 21.0% | 13.3% |
| Interquartile Range (IQR) | 8.0% | 7.5% |
| Standard Deviation (Sample) | 21.2% | 8.1% |
| Standard Deviation (Population) | 21.1% | 7.9% |
Similar Demographics by Single Male Poverty
Demographics Similar to Immigrants from Mexico by Single Male Poverty
In terms of single male poverty, the demographic groups most similar to Immigrants from Mexico are German (13.9%, a difference of 0.070%), Scottish (14.0%, a difference of 0.16%), Immigrants from Saudi Arabia (14.0%, a difference of 0.17%), Irish (14.0%, a difference of 0.20%), and Immigrants from Cabo Verde (13.9%, a difference of 0.23%).
| Demographics | Rating | Rank | Single Male Poverty |
| Hungarians | 0.3 /100 | #261 | Tragic 13.8% |
| Fijians | 0.3 /100 | #262 | Tragic 13.8% |
| Cape Verdeans | 0.2 /100 | #263 | Tragic 13.8% |
| West Indians | 0.2 /100 | #264 | Tragic 13.8% |
| Immigrants | Congo | 0.2 /100 | #265 | Tragic 13.9% |
| Immigrants | Cabo Verde | 0.1 /100 | #266 | Tragic 13.9% |
| Germans | 0.1 /100 | #267 | Tragic 13.9% |
| Immigrants | Mexico | 0.1 /100 | #268 | Tragic 13.9% |
| Scottish | 0.1 /100 | #269 | Tragic 14.0% |
| Immigrants | Saudi Arabia | 0.1 /100 | #270 | Tragic 14.0% |
| Irish | 0.1 /100 | #271 | Tragic 14.0% |
| Mexicans | 0.1 /100 | #272 | Tragic 14.0% |
| Welsh | 0.1 /100 | #273 | Tragic 14.0% |
| Hondurans | 0.1 /100 | #274 | Tragic 14.0% |
| English | 0.1 /100 | #275 | Tragic 14.1% |
Demographics Similar to Ugandans by Single Male Poverty
In terms of single male poverty, the demographic groups most similar to Ugandans are Immigrants from Eastern Africa (12.3%, a difference of 0.13%), Iraqi (12.3%, a difference of 0.15%), Immigrants from Portugal (12.3%, a difference of 0.23%), Immigrants from North Macedonia (12.3%, a difference of 0.24%), and Kenyan (12.4%, a difference of 0.30%).
| Demographics | Rating | Rank | Single Male Poverty |
| Immigrants | Europe | 97.0 /100 | #102 | Exceptional 12.2% |
| Immigrants | Armenia | 96.7 /100 | #103 | Exceptional 12.2% |
| Immigrants | Kazakhstan | 96.7 /100 | #104 | Exceptional 12.2% |
| Jordanians | 95.9 /100 | #105 | Exceptional 12.3% |
| Immigrants | Morocco | 95.6 /100 | #106 | Exceptional 12.3% |
| Iraqis | 95.1 /100 | #107 | Exceptional 12.3% |
| Immigrants | Eastern Africa | 95.0 /100 | #108 | Exceptional 12.3% |
| Ugandans | 94.5 /100 | #109 | Exceptional 12.3% |
| Immigrants | Portugal | 93.6 /100 | #110 | Exceptional 12.3% |
| Immigrants | North Macedonia | 93.6 /100 | #111 | Exceptional 12.3% |
| Kenyans | 93.3 /100 | #112 | Exceptional 12.4% |
| Pakistanis | 92.4 /100 | #113 | Exceptional 12.4% |
| Nicaraguans | 92.1 /100 | #114 | Exceptional 12.4% |
| Immigrants | Southern Europe | 91.5 /100 | #115 | Exceptional 12.4% |
| Immigrants | Syria | 91.2 /100 | #116 | Exceptional 12.4% |