Slovak vs Potawatomi Poverty
COMPARE
Slovak
Potawatomi
Poverty
Poverty Comparison
Slovaks
Potawatomi
11.2%
POVERTY
97.4/ 100
METRIC RATING
68th/ 347
METRIC RANK
14.1%
POVERTY
0.3/ 100
METRIC RATING
246th/ 347
METRIC RANK
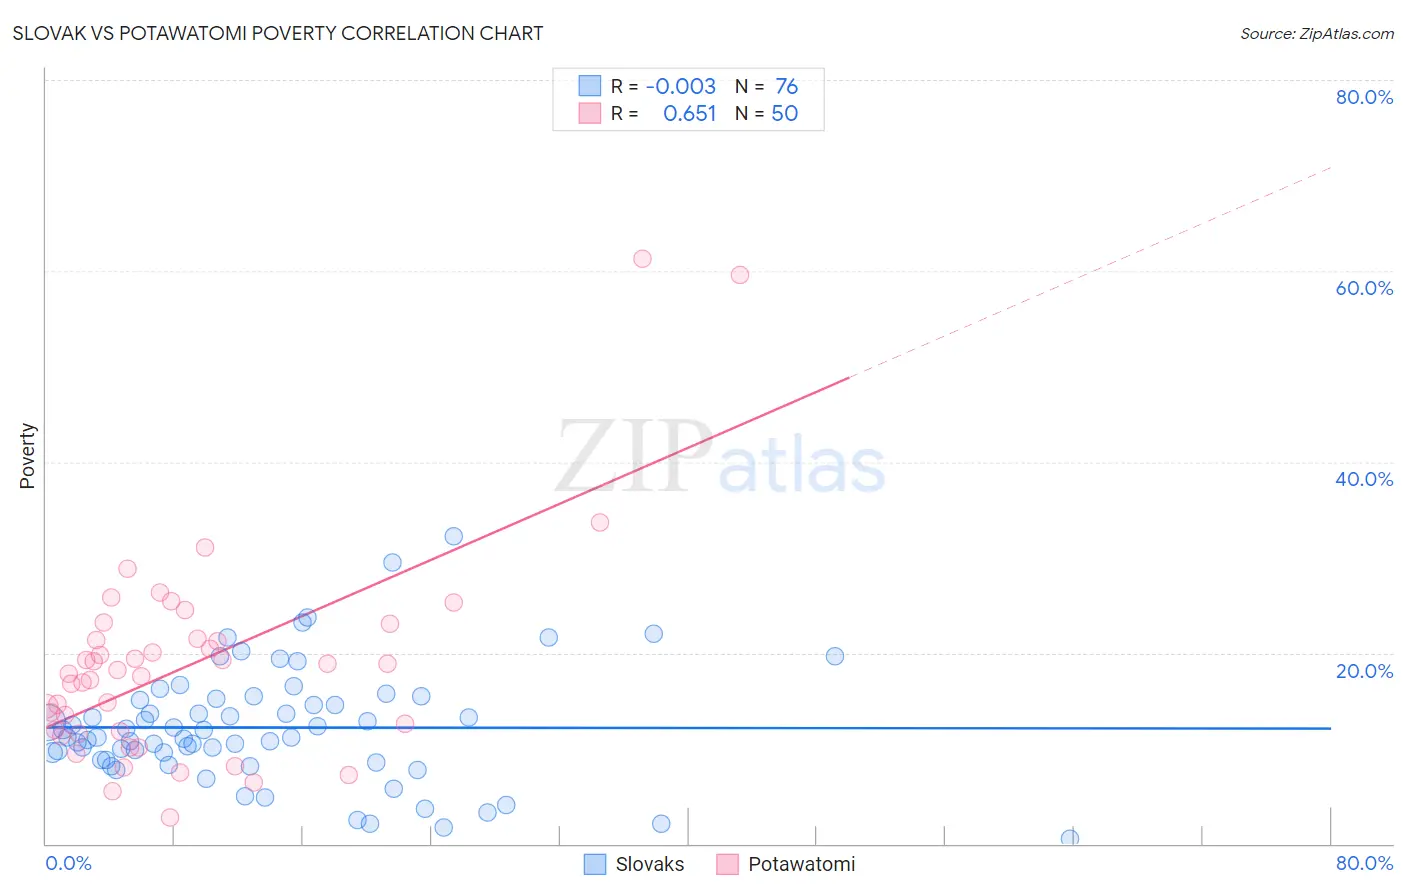
Slovak vs Potawatomi Poverty Correlation Chart
The statistical analysis conducted on geographies consisting of 397,661,744 people shows no correlation between the proportion of Slovaks and poverty level in the United States with a correlation coefficient (R) of -0.003 and weighted average of 11.2%. Similarly, the statistical analysis conducted on geographies consisting of 117,756,433 people shows a significant positive correlation between the proportion of Potawatomi and poverty level in the United States with a correlation coefficient (R) of 0.651 and weighted average of 14.1%, a difference of 25.5%.
Poverty Correlation Summary
| Measurement | Slovak | Potawatomi |
| Minimum | 0.55% | 2.7% |
| Maximum | 32.2% | 61.3% |
| Range | 31.6% | 58.6% |
| Mean | 12.2% | 18.7% |
| Median | 11.1% | 18.0% |
| Interquartile 25% (IQ1) | 8.8% | 11.8% |
| Interquartile 75% (IQ3) | 15.1% | 21.5% |
| Interquartile Range (IQR) | 6.4% | 9.7% |
| Standard Deviation (Sample) | 6.1% | 11.0% |
| Standard Deviation (Population) | 6.0% | 10.9% |
Similar Demographics by Poverty
Demographics Similar to Slovaks by Poverty
In terms of poverty, the demographic groups most similar to Slovaks are Immigrants from Australia (11.2%, a difference of 0.020%), Immigrants from Netherlands (11.2%, a difference of 0.060%), Serbian (11.2%, a difference of 0.060%), Immigrants from Asia (11.2%, a difference of 0.13%), and Immigrants from Canada (11.3%, a difference of 0.15%).
| Demographics | Rating | Rank | Poverty |
| Immigrants | Italy | 97.9 /100 | #61 | Exceptional 11.2% |
| Austrians | 97.8 /100 | #62 | Exceptional 11.2% |
| Ukrainians | 97.8 /100 | #63 | Exceptional 11.2% |
| Swiss | 97.7 /100 | #64 | Exceptional 11.2% |
| Immigrants | Asia | 97.5 /100 | #65 | Exceptional 11.2% |
| Immigrants | Netherlands | 97.5 /100 | #66 | Exceptional 11.2% |
| Immigrants | Australia | 97.4 /100 | #67 | Exceptional 11.2% |
| Slovaks | 97.4 /100 | #68 | Exceptional 11.2% |
| Serbians | 97.4 /100 | #69 | Exceptional 11.2% |
| Immigrants | Canada | 97.3 /100 | #70 | Exceptional 11.3% |
| Zimbabweans | 97.3 /100 | #71 | Exceptional 11.3% |
| Europeans | 97.2 /100 | #72 | Exceptional 11.3% |
| Immigrants | Belgium | 97.2 /100 | #73 | Exceptional 11.3% |
| Carpatho Rusyns | 97.2 /100 | #74 | Exceptional 11.3% |
| Immigrants | Eastern Europe | 97.0 /100 | #75 | Exceptional 11.3% |
Demographics Similar to Potawatomi by Poverty
In terms of poverty, the demographic groups most similar to Potawatomi are Immigrants from Sudan (14.1%, a difference of 0.20%), Liberian (14.1%, a difference of 0.28%), Immigrants from Western Africa (14.1%, a difference of 0.30%), Immigrants from Ghana (14.2%, a difference of 0.40%), and Nepalese (14.0%, a difference of 0.59%).
| Demographics | Rating | Rank | Poverty |
| Nicaraguans | 0.4 /100 | #239 | Tragic 13.9% |
| Immigrants | Middle Africa | 0.4 /100 | #240 | Tragic 14.0% |
| Salvadorans | 0.4 /100 | #241 | Tragic 14.0% |
| Ecuadorians | 0.4 /100 | #242 | Tragic 14.0% |
| Sudanese | 0.3 /100 | #243 | Tragic 14.0% |
| Nepalese | 0.3 /100 | #244 | Tragic 14.0% |
| Immigrants | Sudan | 0.3 /100 | #245 | Tragic 14.1% |
| Potawatomi | 0.3 /100 | #246 | Tragic 14.1% |
| Liberians | 0.2 /100 | #247 | Tragic 14.1% |
| Immigrants | Western Africa | 0.2 /100 | #248 | Tragic 14.1% |
| Immigrants | Ghana | 0.2 /100 | #249 | Tragic 14.2% |
| Cree | 0.2 /100 | #250 | Tragic 14.2% |
| Immigrants | Burma/Myanmar | 0.2 /100 | #251 | Tragic 14.2% |
| Spanish American Indians | 0.2 /100 | #252 | Tragic 14.2% |
| Immigrants | Trinidad and Tobago | 0.2 /100 | #253 | Tragic 14.2% |