Slovak vs Cajun Poverty
COMPARE
Slovak
Cajun
Poverty
Poverty Comparison
Slovaks
Cajuns
11.2%
POVERTY
97.4/ 100
METRIC RATING
68th/ 347
METRIC RANK
15.7%
POVERTY
0.0/ 100
METRIC RATING
312th/ 347
METRIC RANK
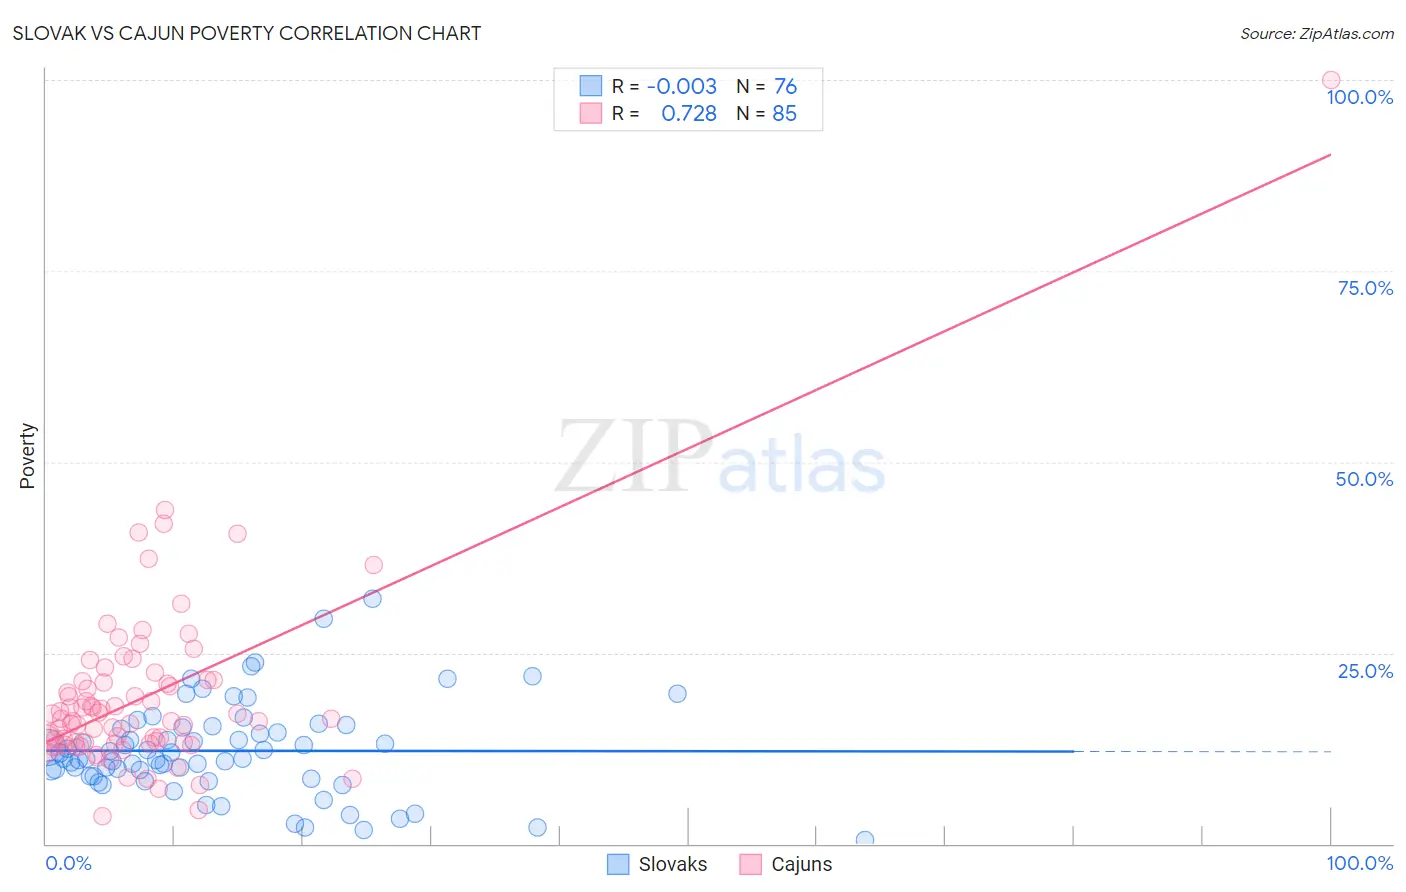
Slovak vs Cajun Poverty Correlation Chart
The statistical analysis conducted on geographies consisting of 397,661,744 people shows no correlation between the proportion of Slovaks and poverty level in the United States with a correlation coefficient (R) of -0.003 and weighted average of 11.2%. Similarly, the statistical analysis conducted on geographies consisting of 149,691,994 people shows a strong positive correlation between the proportion of Cajuns and poverty level in the United States with a correlation coefficient (R) of 0.728 and weighted average of 15.7%, a difference of 39.8%.
Poverty Correlation Summary
| Measurement | Slovak | Cajun |
| Minimum | 0.55% | 3.7% |
| Maximum | 32.2% | 100.0% |
| Range | 31.6% | 96.3% |
| Mean | 12.2% | 19.2% |
| Median | 11.1% | 16.3% |
| Interquartile 25% (IQ1) | 8.8% | 13.1% |
| Interquartile 75% (IQ3) | 15.1% | 21.3% |
| Interquartile Range (IQR) | 6.4% | 8.2% |
| Standard Deviation (Sample) | 6.1% | 12.0% |
| Standard Deviation (Population) | 6.0% | 11.9% |
Similar Demographics by Poverty
Demographics Similar to Slovaks by Poverty
In terms of poverty, the demographic groups most similar to Slovaks are Immigrants from Australia (11.2%, a difference of 0.020%), Immigrants from Netherlands (11.2%, a difference of 0.060%), Serbian (11.2%, a difference of 0.060%), Immigrants from Asia (11.2%, a difference of 0.13%), and Immigrants from Canada (11.3%, a difference of 0.15%).
| Demographics | Rating | Rank | Poverty |
| Immigrants | Italy | 97.9 /100 | #61 | Exceptional 11.2% |
| Austrians | 97.8 /100 | #62 | Exceptional 11.2% |
| Ukrainians | 97.8 /100 | #63 | Exceptional 11.2% |
| Swiss | 97.7 /100 | #64 | Exceptional 11.2% |
| Immigrants | Asia | 97.5 /100 | #65 | Exceptional 11.2% |
| Immigrants | Netherlands | 97.5 /100 | #66 | Exceptional 11.2% |
| Immigrants | Australia | 97.4 /100 | #67 | Exceptional 11.2% |
| Slovaks | 97.4 /100 | #68 | Exceptional 11.2% |
| Serbians | 97.4 /100 | #69 | Exceptional 11.2% |
| Immigrants | Canada | 97.3 /100 | #70 | Exceptional 11.3% |
| Zimbabweans | 97.3 /100 | #71 | Exceptional 11.3% |
| Europeans | 97.2 /100 | #72 | Exceptional 11.3% |
| Immigrants | Belgium | 97.2 /100 | #73 | Exceptional 11.3% |
| Carpatho Rusyns | 97.2 /100 | #74 | Exceptional 11.3% |
| Immigrants | Eastern Europe | 97.0 /100 | #75 | Exceptional 11.3% |
Demographics Similar to Cajuns by Poverty
In terms of poverty, the demographic groups most similar to Cajuns are Chippewa (15.7%, a difference of 0.16%), Immigrants from Grenada (15.8%, a difference of 0.44%), Dutch West Indian (15.6%, a difference of 0.54%), Immigrants from Somalia (15.8%, a difference of 0.56%), and Seminole (15.6%, a difference of 0.63%).
| Demographics | Rating | Rank | Poverty |
| Immigrants | Guatemala | 0.0 /100 | #305 | Tragic 15.5% |
| Creek | 0.0 /100 | #306 | Tragic 15.6% |
| Africans | 0.0 /100 | #307 | Tragic 15.6% |
| Choctaw | 0.0 /100 | #308 | Tragic 15.6% |
| Seminole | 0.0 /100 | #309 | Tragic 15.6% |
| Dutch West Indians | 0.0 /100 | #310 | Tragic 15.6% |
| Chippewa | 0.0 /100 | #311 | Tragic 15.7% |
| Cajuns | 0.0 /100 | #312 | Tragic 15.7% |
| Immigrants | Grenada | 0.0 /100 | #313 | Tragic 15.8% |
| Immigrants | Somalia | 0.0 /100 | #314 | Tragic 15.8% |
| British West Indians | 0.0 /100 | #315 | Tragic 15.9% |
| Hondurans | 0.0 /100 | #316 | Tragic 15.9% |
| U.S. Virgin Islanders | 0.0 /100 | #317 | Tragic 16.1% |
| Immigrants | Dominica | 0.0 /100 | #318 | Tragic 16.1% |
| Immigrants | Congo | 0.0 /100 | #319 | Tragic 16.1% |