Slovak vs Bolivian Poverty
COMPARE
Slovak
Bolivian
Poverty
Poverty Comparison
Slovaks
Bolivians
11.2%
POVERTY
97.4/ 100
METRIC RATING
68th/ 347
METRIC RANK
10.4%
POVERTY
99.8/ 100
METRIC RATING
15th/ 347
METRIC RANK
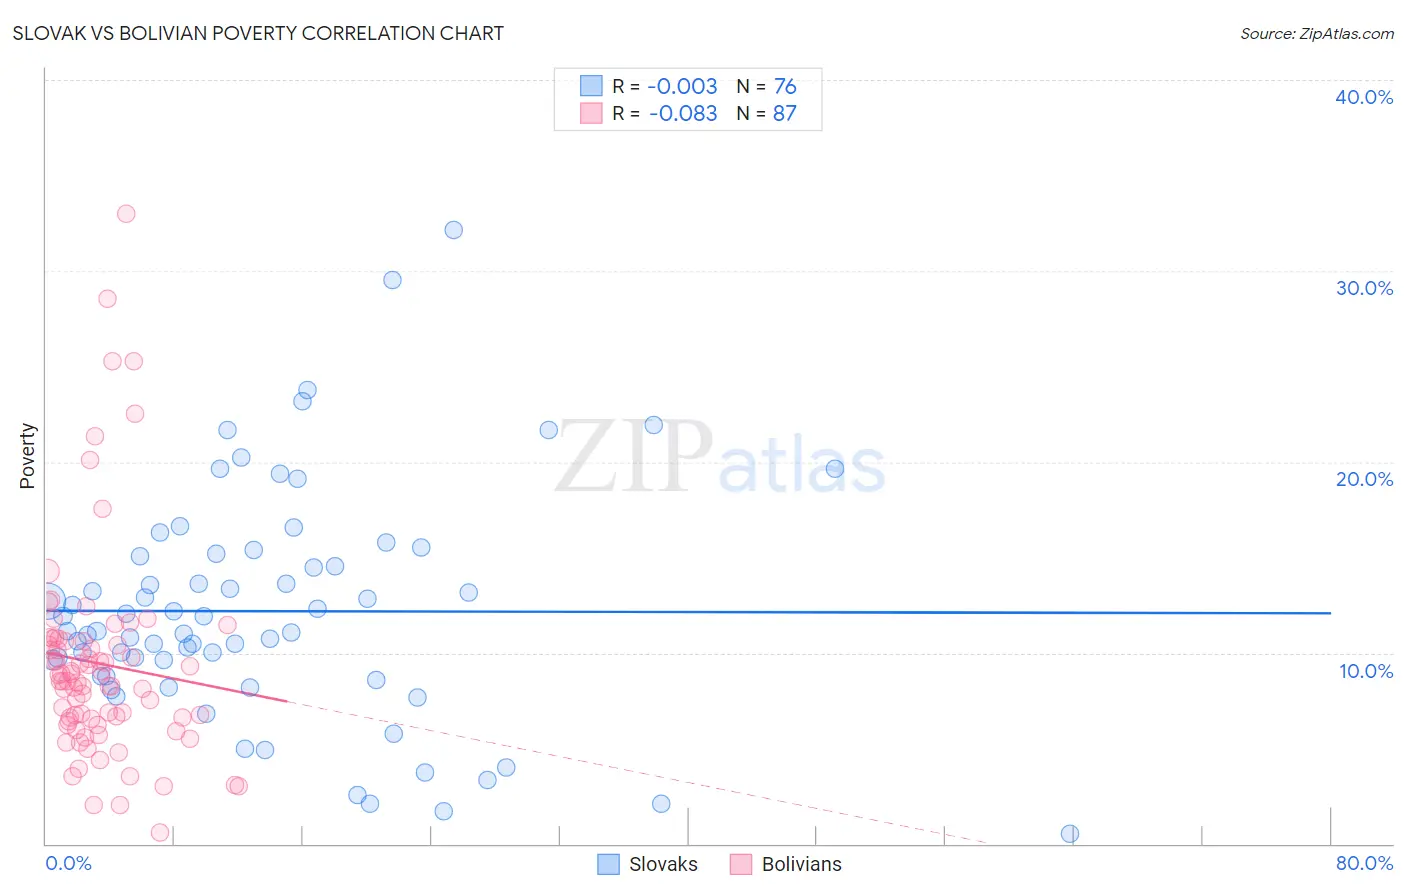
Slovak vs Bolivian Poverty Correlation Chart
The statistical analysis conducted on geographies consisting of 397,661,744 people shows no correlation between the proportion of Slovaks and poverty level in the United States with a correlation coefficient (R) of -0.003 and weighted average of 11.2%. Similarly, the statistical analysis conducted on geographies consisting of 184,629,688 people shows a slight negative correlation between the proportion of Bolivians and poverty level in the United States with a correlation coefficient (R) of -0.083 and weighted average of 10.4%, a difference of 7.6%.
Poverty Correlation Summary
| Measurement | Slovak | Bolivian |
| Minimum | 0.55% | 0.58% |
| Maximum | 32.2% | 33.0% |
| Range | 31.6% | 32.4% |
| Mean | 12.2% | 9.4% |
| Median | 11.1% | 8.5% |
| Interquartile 25% (IQ1) | 8.8% | 6.4% |
| Interquartile 75% (IQ3) | 15.1% | 10.6% |
| Interquartile Range (IQR) | 6.4% | 4.2% |
| Standard Deviation (Sample) | 6.1% | 5.6% |
| Standard Deviation (Population) | 6.0% | 5.6% |
Similar Demographics by Poverty
Demographics Similar to Slovaks by Poverty
In terms of poverty, the demographic groups most similar to Slovaks are Immigrants from Australia (11.2%, a difference of 0.020%), Immigrants from Netherlands (11.2%, a difference of 0.060%), Serbian (11.2%, a difference of 0.060%), Immigrants from Asia (11.2%, a difference of 0.13%), and Immigrants from Canada (11.3%, a difference of 0.15%).
| Demographics | Rating | Rank | Poverty |
| Immigrants | Italy | 97.9 /100 | #61 | Exceptional 11.2% |
| Austrians | 97.8 /100 | #62 | Exceptional 11.2% |
| Ukrainians | 97.8 /100 | #63 | Exceptional 11.2% |
| Swiss | 97.7 /100 | #64 | Exceptional 11.2% |
| Immigrants | Asia | 97.5 /100 | #65 | Exceptional 11.2% |
| Immigrants | Netherlands | 97.5 /100 | #66 | Exceptional 11.2% |
| Immigrants | Australia | 97.4 /100 | #67 | Exceptional 11.2% |
| Slovaks | 97.4 /100 | #68 | Exceptional 11.2% |
| Serbians | 97.4 /100 | #69 | Exceptional 11.2% |
| Immigrants | Canada | 97.3 /100 | #70 | Exceptional 11.3% |
| Zimbabweans | 97.3 /100 | #71 | Exceptional 11.3% |
| Europeans | 97.2 /100 | #72 | Exceptional 11.3% |
| Immigrants | Belgium | 97.2 /100 | #73 | Exceptional 11.3% |
| Carpatho Rusyns | 97.2 /100 | #74 | Exceptional 11.3% |
| Immigrants | Eastern Europe | 97.0 /100 | #75 | Exceptional 11.3% |
Demographics Similar to Bolivians by Poverty
In terms of poverty, the demographic groups most similar to Bolivians are Immigrants from Bolivia (10.4%, a difference of 0.010%), Lithuanian (10.5%, a difference of 0.30%), Immigrants from Hong Kong (10.4%, a difference of 0.32%), Bhutanese (10.4%, a difference of 0.54%), and Norwegian (10.5%, a difference of 0.67%).
| Demographics | Rating | Rank | Poverty |
| Maltese | 99.9 /100 | #8 | Exceptional 10.2% |
| Immigrants | South Central Asia | 99.9 /100 | #9 | Exceptional 10.2% |
| Bulgarians | 99.9 /100 | #10 | Exceptional 10.2% |
| Immigrants | Lithuania | 99.9 /100 | #11 | Exceptional 10.3% |
| Bhutanese | 99.8 /100 | #12 | Exceptional 10.4% |
| Immigrants | Hong Kong | 99.8 /100 | #13 | Exceptional 10.4% |
| Immigrants | Bolivia | 99.8 /100 | #14 | Exceptional 10.4% |
| Bolivians | 99.8 /100 | #15 | Exceptional 10.4% |
| Lithuanians | 99.8 /100 | #16 | Exceptional 10.5% |
| Norwegians | 99.8 /100 | #17 | Exceptional 10.5% |
| Latvians | 99.8 /100 | #18 | Exceptional 10.5% |
| Immigrants | Scotland | 99.7 /100 | #19 | Exceptional 10.6% |
| Immigrants | North Macedonia | 99.7 /100 | #20 | Exceptional 10.6% |
| Luxembourgers | 99.7 /100 | #21 | Exceptional 10.6% |
| Eastern Europeans | 99.7 /100 | #22 | Exceptional 10.6% |