Immigrants from Dominica vs Immigrants from Belize Single Male Poverty
COMPARE
Immigrants from Dominica
Immigrants from Belize
Single Male Poverty
Single Male Poverty Comparison
Immigrants from Dominica
Immigrants from Belize
14.5%
SINGLE MALE POVERTY
0.0/ 100
METRIC RATING
289th/ 347
METRIC RANK
13.7%
SINGLE MALE POVERTY
0.4/ 100
METRIC RATING
256th/ 347
METRIC RANK
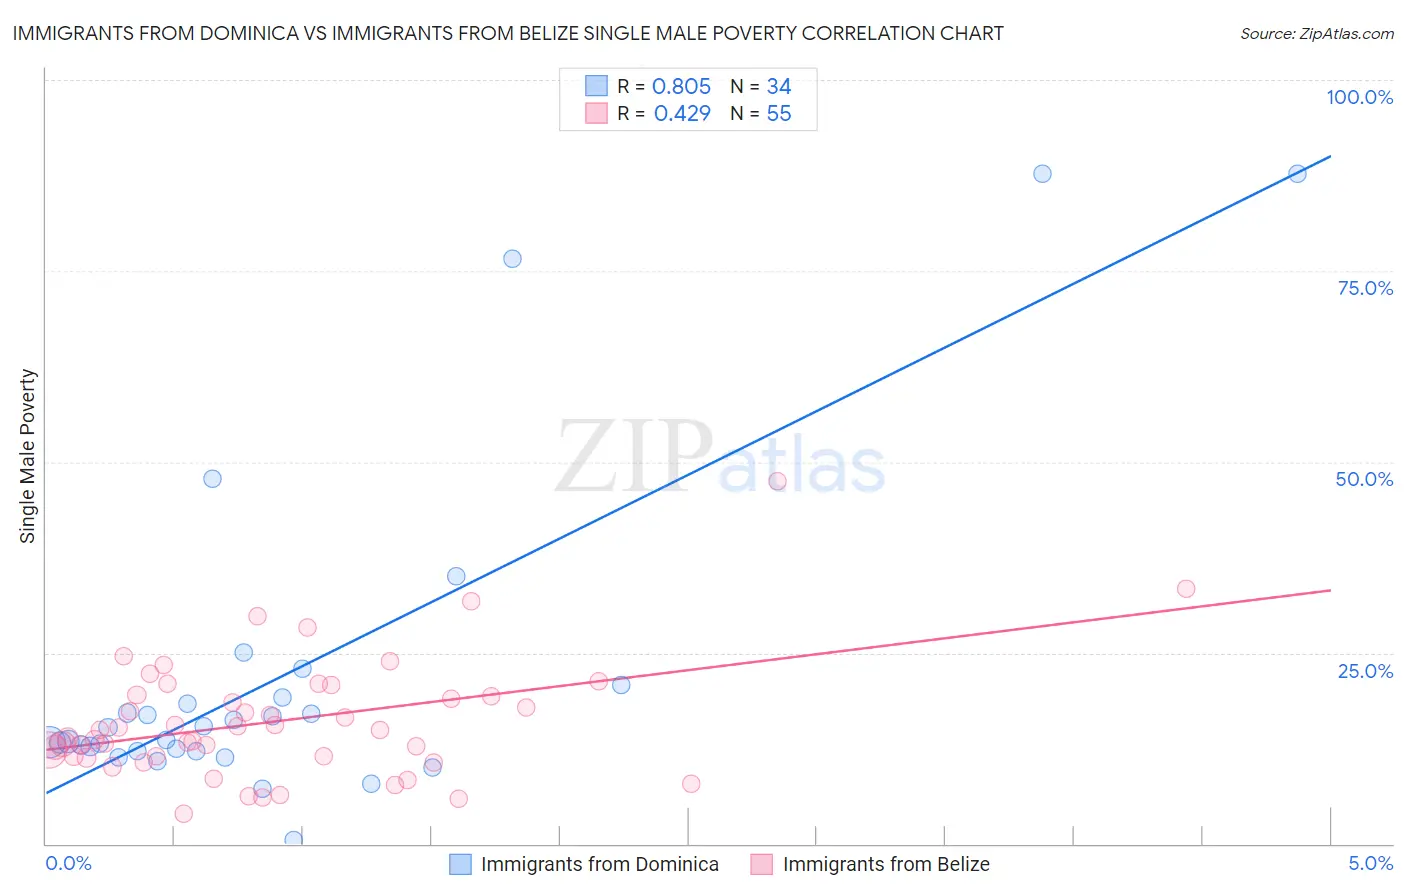
Immigrants from Dominica vs Immigrants from Belize Single Male Poverty Correlation Chart
The statistical analysis conducted on geographies consisting of 81,406,108 people shows a very strong positive correlation between the proportion of Immigrants from Dominica and poverty level among single males in the United States with a correlation coefficient (R) of 0.805 and weighted average of 14.5%. Similarly, the statistical analysis conducted on geographies consisting of 125,025,572 people shows a moderate positive correlation between the proportion of Immigrants from Belize and poverty level among single males in the United States with a correlation coefficient (R) of 0.429 and weighted average of 13.7%, a difference of 5.6%.
Single Male Poverty Correlation Summary
| Measurement | Immigrants from Dominica | Immigrants from Belize |
| Minimum | 0.56% | 4.0% |
| Maximum | 87.7% | 47.5% |
| Range | 87.1% | 43.5% |
| Mean | 21.9% | 16.1% |
| Median | 14.4% | 14.8% |
| Interquartile 25% (IQ1) | 12.1% | 11.5% |
| Interquartile 75% (IQ3) | 19.1% | 19.5% |
| Interquartile Range (IQR) | 7.0% | 8.0% |
| Standard Deviation (Sample) | 21.3% | 7.8% |
| Standard Deviation (Population) | 20.9% | 7.8% |
Similar Demographics by Single Male Poverty
Demographics Similar to Immigrants from Dominica by Single Male Poverty
In terms of single male poverty, the demographic groups most similar to Immigrants from Dominica are Iroquois (14.5%, a difference of 0.090%), White/Caucasian (14.5%, a difference of 0.090%), Celtic (14.5%, a difference of 0.22%), U.S. Virgin Islander (14.5%, a difference of 0.23%), and Bahamian (14.6%, a difference of 0.38%).
| Demographics | Rating | Rank | Single Male Poverty |
| Spanish Americans | 0.0 /100 | #282 | Tragic 14.2% |
| Yaqui | 0.0 /100 | #283 | Tragic 14.2% |
| Immigrants | Bahamas | 0.0 /100 | #284 | Tragic 14.4% |
| French | 0.0 /100 | #285 | Tragic 14.4% |
| Celtics | 0.0 /100 | #286 | Tragic 14.5% |
| Iroquois | 0.0 /100 | #287 | Tragic 14.5% |
| Whites/Caucasians | 0.0 /100 | #288 | Tragic 14.5% |
| Immigrants | Dominica | 0.0 /100 | #289 | Tragic 14.5% |
| U.S. Virgin Islanders | 0.0 /100 | #290 | Tragic 14.5% |
| Bahamians | 0.0 /100 | #291 | Tragic 14.6% |
| Immigrants | Nonimmigrants | 0.0 /100 | #292 | Tragic 14.6% |
| French Canadians | 0.0 /100 | #293 | Tragic 14.6% |
| Ottawa | 0.0 /100 | #294 | Tragic 14.6% |
| Scotch-Irish | 0.0 /100 | #295 | Tragic 14.7% |
| Africans | 0.0 /100 | #296 | Tragic 14.7% |
Demographics Similar to Immigrants from Belize by Single Male Poverty
In terms of single male poverty, the demographic groups most similar to Immigrants from Belize are Spaniard (13.7%, a difference of 0.10%), Immigrants from Central America (13.8%, a difference of 0.18%), Subsaharan African (13.7%, a difference of 0.21%), Immigrants from Guatemala (13.8%, a difference of 0.25%), and Guatemalan (13.8%, a difference of 0.29%).
| Demographics | Rating | Rank | Single Male Poverty |
| Spanish | 1.0 /100 | #249 | Tragic 13.6% |
| Immigrants | Somalia | 1.0 /100 | #250 | Tragic 13.6% |
| Immigrants | Zaire | 0.9 /100 | #251 | Tragic 13.6% |
| Finns | 0.9 /100 | #252 | Tragic 13.6% |
| German Russians | 0.8 /100 | #253 | Tragic 13.6% |
| Sub-Saharan Africans | 0.5 /100 | #254 | Tragic 13.7% |
| Spaniards | 0.4 /100 | #255 | Tragic 13.7% |
| Immigrants | Belize | 0.4 /100 | #256 | Tragic 13.7% |
| Immigrants | Central America | 0.3 /100 | #257 | Tragic 13.8% |
| Immigrants | Guatemala | 0.3 /100 | #258 | Tragic 13.8% |
| Guatemalans | 0.3 /100 | #259 | Tragic 13.8% |
| Swiss | 0.3 /100 | #260 | Tragic 13.8% |
| Hungarians | 0.3 /100 | #261 | Tragic 13.8% |
| Fijians | 0.3 /100 | #262 | Tragic 13.8% |
| Cape Verdeans | 0.2 /100 | #263 | Tragic 13.8% |