Bolivian vs Immigrants from Belize Single Male Poverty
COMPARE
Bolivian
Immigrants from Belize
Single Male Poverty
Single Male Poverty Comparison
Bolivians
Immigrants from Belize
11.2%
SINGLE MALE POVERTY
100.0/ 100
METRIC RATING
23rd/ 347
METRIC RANK
13.7%
SINGLE MALE POVERTY
0.4/ 100
METRIC RATING
256th/ 347
METRIC RANK
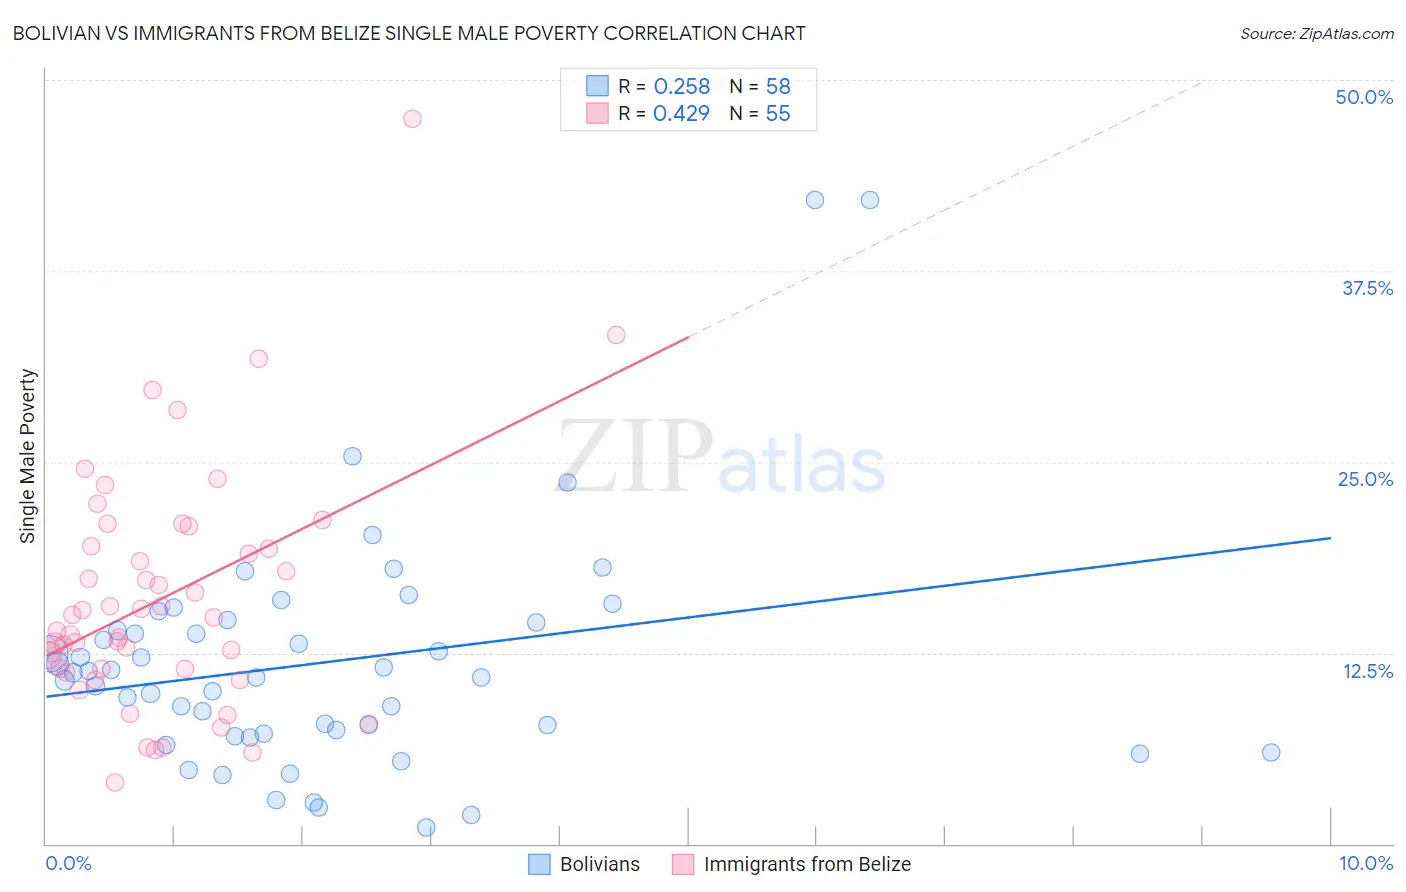
Bolivian vs Immigrants from Belize Single Male Poverty Correlation Chart
The statistical analysis conducted on geographies consisting of 171,550,226 people shows a weak positive correlation between the proportion of Bolivians and poverty level among single males in the United States with a correlation coefficient (R) of 0.258 and weighted average of 11.2%. Similarly, the statistical analysis conducted on geographies consisting of 125,025,572 people shows a moderate positive correlation between the proportion of Immigrants from Belize and poverty level among single males in the United States with a correlation coefficient (R) of 0.429 and weighted average of 13.7%, a difference of 22.2%.
Single Male Poverty Correlation Summary
| Measurement | Bolivian | Immigrants from Belize |
| Minimum | 1.1% | 4.0% |
| Maximum | 42.1% | 47.5% |
| Range | 41.0% | 43.5% |
| Mean | 11.9% | 16.1% |
| Median | 11.1% | 14.8% |
| Interquartile 25% (IQ1) | 7.2% | 11.5% |
| Interquartile 75% (IQ3) | 14.5% | 19.5% |
| Interquartile Range (IQR) | 7.3% | 8.0% |
| Standard Deviation (Sample) | 7.7% | 7.8% |
| Standard Deviation (Population) | 7.6% | 7.8% |
Similar Demographics by Single Male Poverty
Demographics Similar to Bolivians by Single Male Poverty
In terms of single male poverty, the demographic groups most similar to Bolivians are Indian (Asian) (11.3%, a difference of 0.20%), Immigrants from Pakistan (11.2%, a difference of 0.21%), Maltese (11.3%, a difference of 0.22%), Asian (11.2%, a difference of 0.30%), and Immigrants from Japan (11.3%, a difference of 0.55%).
| Demographics | Rating | Rank | Single Male Poverty |
| Bhutanese | 100.0 /100 | #16 | Exceptional 11.1% |
| Tsimshian | 100.0 /100 | #17 | Exceptional 11.1% |
| Immigrants | Bolivia | 100.0 /100 | #18 | Exceptional 11.1% |
| Immigrants | Moldova | 100.0 /100 | #19 | Exceptional 11.2% |
| Ethiopians | 100.0 /100 | #20 | Exceptional 11.2% |
| Asians | 100.0 /100 | #21 | Exceptional 11.2% |
| Immigrants | Pakistan | 100.0 /100 | #22 | Exceptional 11.2% |
| Bolivians | 100.0 /100 | #23 | Exceptional 11.2% |
| Indians (Asian) | 100.0 /100 | #24 | Exceptional 11.3% |
| Maltese | 100.0 /100 | #25 | Exceptional 11.3% |
| Immigrants | Japan | 100.0 /100 | #26 | Exceptional 11.3% |
| Immigrants | China | 100.0 /100 | #27 | Exceptional 11.4% |
| Immigrants | Asia | 100.0 /100 | #28 | Exceptional 11.4% |
| Immigrants | Egypt | 100.0 /100 | #29 | Exceptional 11.4% |
| Iranians | 100.0 /100 | #30 | Exceptional 11.4% |
Demographics Similar to Immigrants from Belize by Single Male Poverty
In terms of single male poverty, the demographic groups most similar to Immigrants from Belize are Spaniard (13.7%, a difference of 0.10%), Immigrants from Central America (13.8%, a difference of 0.18%), Subsaharan African (13.7%, a difference of 0.21%), Immigrants from Guatemala (13.8%, a difference of 0.25%), and Guatemalan (13.8%, a difference of 0.29%).
| Demographics | Rating | Rank | Single Male Poverty |
| Spanish | 1.0 /100 | #249 | Tragic 13.6% |
| Immigrants | Somalia | 1.0 /100 | #250 | Tragic 13.6% |
| Immigrants | Zaire | 0.9 /100 | #251 | Tragic 13.6% |
| Finns | 0.9 /100 | #252 | Tragic 13.6% |
| German Russians | 0.8 /100 | #253 | Tragic 13.6% |
| Sub-Saharan Africans | 0.5 /100 | #254 | Tragic 13.7% |
| Spaniards | 0.4 /100 | #255 | Tragic 13.7% |
| Immigrants | Belize | 0.4 /100 | #256 | Tragic 13.7% |
| Immigrants | Central America | 0.3 /100 | #257 | Tragic 13.8% |
| Immigrants | Guatemala | 0.3 /100 | #258 | Tragic 13.8% |
| Guatemalans | 0.3 /100 | #259 | Tragic 13.8% |
| Swiss | 0.3 /100 | #260 | Tragic 13.8% |
| Hungarians | 0.3 /100 | #261 | Tragic 13.8% |
| Fijians | 0.3 /100 | #262 | Tragic 13.8% |
| Cape Verdeans | 0.2 /100 | #263 | Tragic 13.8% |