Slovak vs Immigrants from Asia Householder Income Ages 45 - 64 years
COMPARE
Slovak
Immigrants from Asia
Householder Income Ages 45 - 64 years
Householder Income Ages 45 - 64 years Comparison
Slovaks
Immigrants from Asia
$101,029
HOUSEHOLDER INCOME AGES 45 - 64 YEARS
58.8/ 100
METRIC RATING
170th/ 347
METRIC RANK
$116,566
HOUSEHOLDER INCOME AGES 45 - 64 YEARS
100.0/ 100
METRIC RATING
31st/ 347
METRIC RANK
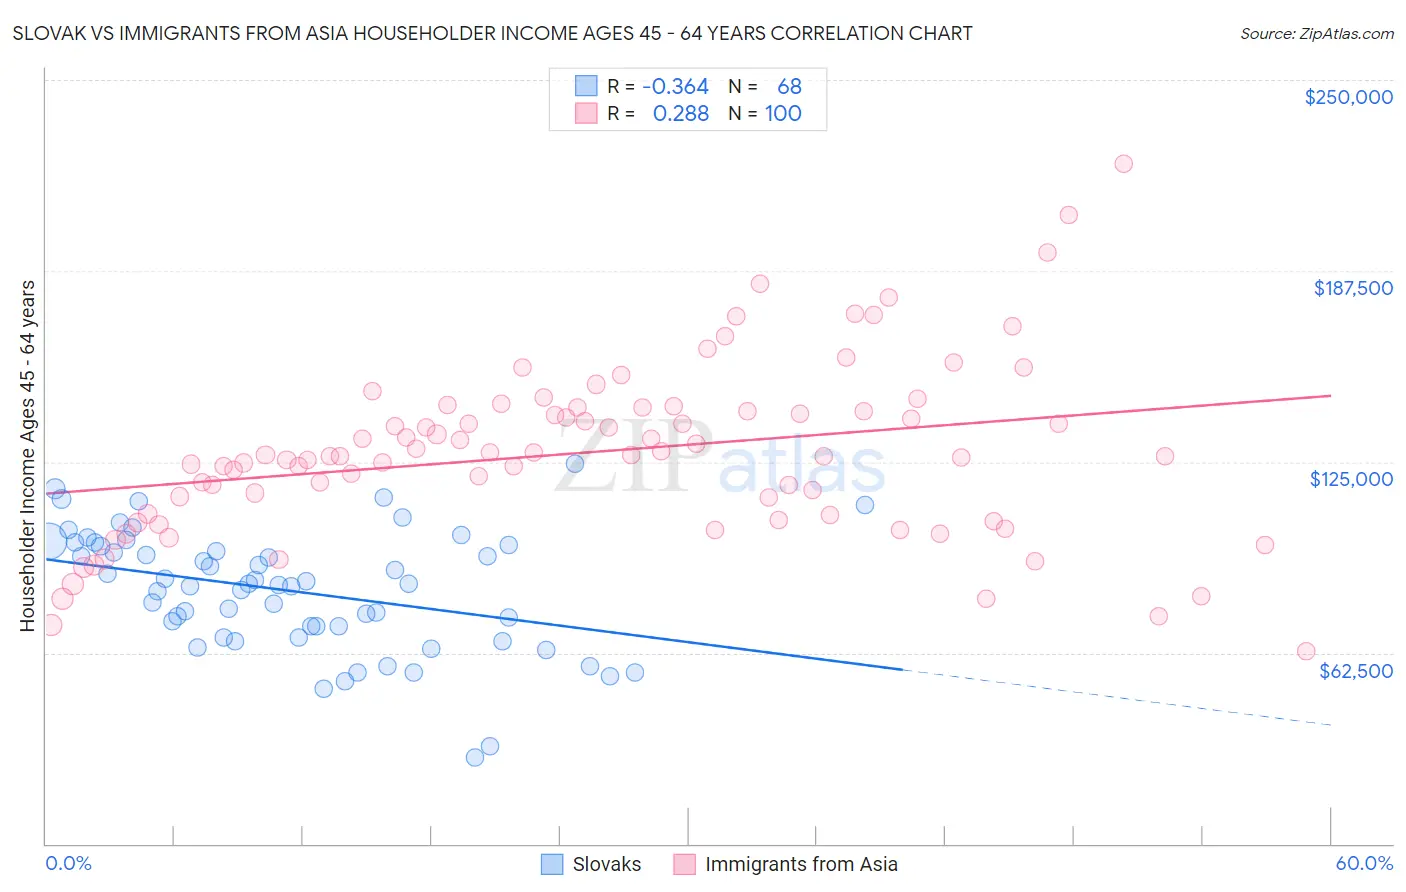
Slovak vs Immigrants from Asia Householder Income Ages 45 - 64 years Correlation Chart
The statistical analysis conducted on geographies consisting of 397,139,632 people shows a mild negative correlation between the proportion of Slovaks and household income with householder between the ages 45 and 64 in the United States with a correlation coefficient (R) of -0.364 and weighted average of $101,029. Similarly, the statistical analysis conducted on geographies consisting of 546,661,171 people shows a weak positive correlation between the proportion of Immigrants from Asia and household income with householder between the ages 45 and 64 in the United States with a correlation coefficient (R) of 0.288 and weighted average of $116,566, a difference of 15.4%.
Householder Income Ages 45 - 64 years Correlation Summary
| Measurement | Slovak | Immigrants from Asia |
| Minimum | $28,125 | $62,982 |
| Maximum | $124,318 | $222,452 |
| Range | $96,193 | $159,470 |
| Mean | $82,752 | $128,196 |
| Median | $84,870 | $127,106 |
| Interquartile 25% (IQ1) | $69,341 | $107,795 |
| Interquartile 75% (IQ3) | $97,616 | $142,101 |
| Interquartile Range (IQR) | $28,275 | $34,306 |
| Standard Deviation (Sample) | $19,751 | $28,288 |
| Standard Deviation (Population) | $19,605 | $28,146 |
Similar Demographics by Householder Income Ages 45 - 64 years
Demographics Similar to Slovaks by Householder Income Ages 45 - 64 years
In terms of householder income ages 45 - 64 years, the demographic groups most similar to Slovaks are South American Indian ($101,171, a difference of 0.14%), Guamanian/Chamorro ($101,170, a difference of 0.14%), South American ($100,837, a difference of 0.19%), Czechoslovakian ($101,387, a difference of 0.35%), and Immigrants from Uzbekistan ($100,523, a difference of 0.50%).
| Demographics | Rating | Rank | Householder Income Ages 45 - 64 years |
| English | 70.1 /100 | #163 | Good $102,021 |
| Immigrants | Morocco | 70.0 /100 | #164 | Good $102,015 |
| Immigrants | Albania | 69.4 /100 | #165 | Good $101,957 |
| Samoans | 65.3 /100 | #166 | Good $101,580 |
| Czechoslovakians | 63.0 /100 | #167 | Good $101,387 |
| South American Indians | 60.5 /100 | #168 | Good $101,171 |
| Guamanians/Chamorros | 60.5 /100 | #169 | Good $101,170 |
| Slovaks | 58.8 /100 | #170 | Average $101,029 |
| South Americans | 56.4 /100 | #171 | Average $100,837 |
| Immigrants | Uzbekistan | 52.5 /100 | #172 | Average $100,523 |
| Alsatians | 51.4 /100 | #173 | Average $100,435 |
| Welsh | 50.0 /100 | #174 | Average $100,322 |
| Germans | 48.8 /100 | #175 | Average $100,224 |
| Immigrants | Costa Rica | 47.7 /100 | #176 | Average $100,141 |
| Moroccans | 47.7 /100 | #177 | Average $100,138 |
Demographics Similar to Immigrants from Asia by Householder Income Ages 45 - 64 years
In terms of householder income ages 45 - 64 years, the demographic groups most similar to Immigrants from Asia are Russian ($116,328, a difference of 0.20%), Chinese ($116,156, a difference of 0.35%), Immigrants from Denmark ($116,000, a difference of 0.49%), Latvian ($115,957, a difference of 0.53%), and Immigrants from Switzerland ($115,934, a difference of 0.54%).
| Demographics | Rating | Rank | Householder Income Ages 45 - 64 years |
| Immigrants | Japan | 100.0 /100 | #24 | Exceptional $118,498 |
| Asians | 100.0 /100 | #25 | Exceptional $118,426 |
| Immigrants | Sweden | 100.0 /100 | #26 | Exceptional $118,318 |
| Immigrants | Northern Europe | 100.0 /100 | #27 | Exceptional $117,930 |
| Turks | 100.0 /100 | #28 | Exceptional $117,814 |
| Bhutanese | 100.0 /100 | #29 | Exceptional $117,750 |
| Immigrants | Bolivia | 100.0 /100 | #30 | Exceptional $117,731 |
| Immigrants | Asia | 100.0 /100 | #31 | Exceptional $116,566 |
| Russians | 100.0 /100 | #32 | Exceptional $116,328 |
| Chinese | 100.0 /100 | #33 | Exceptional $116,156 |
| Immigrants | Denmark | 100.0 /100 | #34 | Exceptional $116,000 |
| Latvians | 100.0 /100 | #35 | Exceptional $115,957 |
| Immigrants | Switzerland | 100.0 /100 | #36 | Exceptional $115,934 |
| Maltese | 99.9 /100 | #37 | Exceptional $114,754 |
| Immigrants | Pakistan | 99.9 /100 | #38 | Exceptional $114,434 |