Slavic vs Nonimmigrants Ambulatory Disability
COMPARE
Slavic
Nonimmigrants
Ambulatory Disability
Ambulatory Disability Comparison
Slavs
Nonimmigrants
6.4%
AMBULATORY DISABILITY
5.1/ 100
METRIC RATING
226th/ 347
METRIC RANK
6.9%
AMBULATORY DISABILITY
0.0/ 100
METRIC RATING
288th/ 347
METRIC RANK
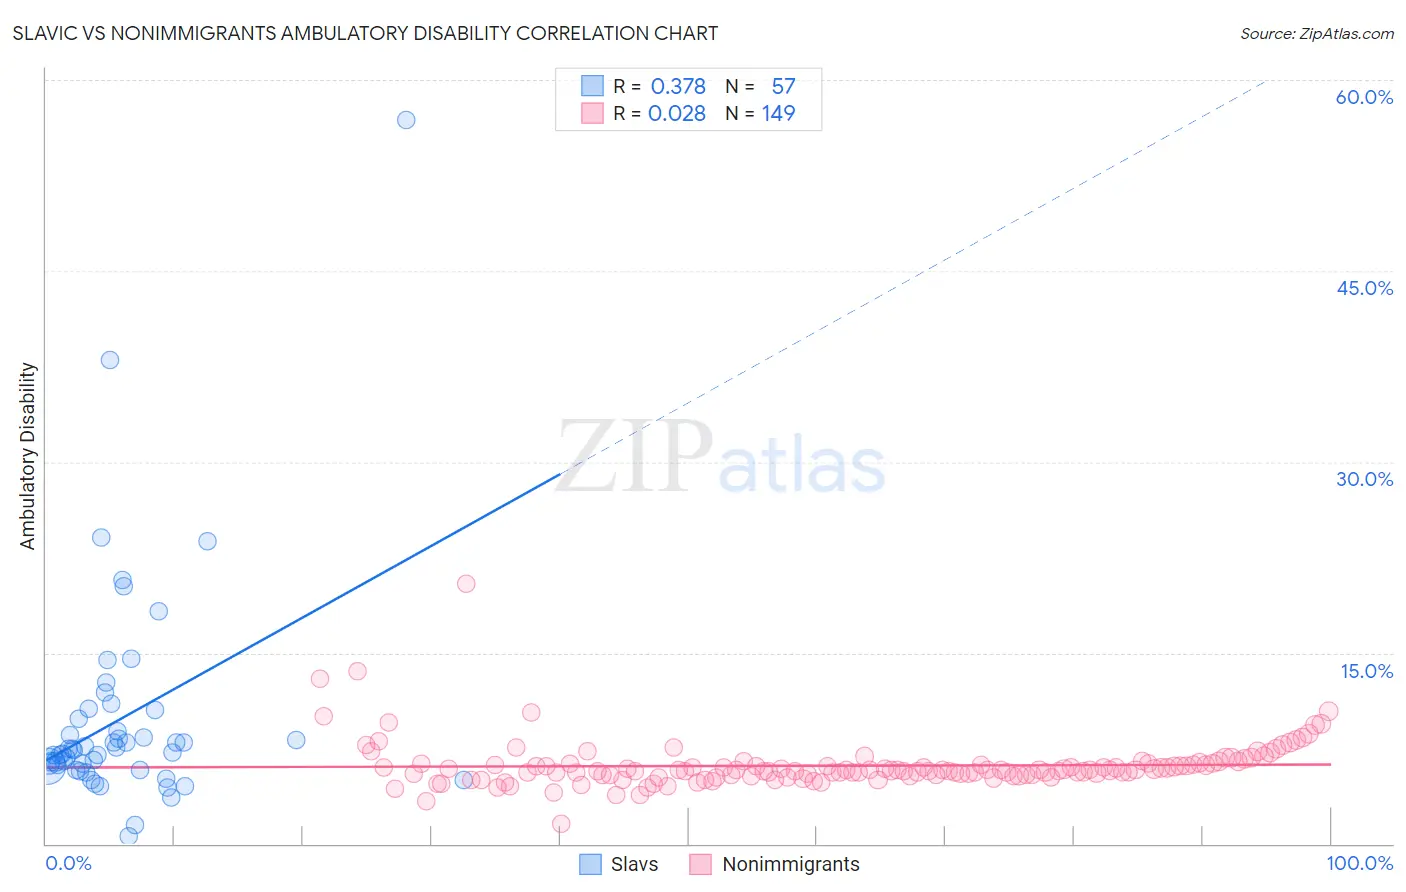
Slavic vs Nonimmigrants Ambulatory Disability Correlation Chart
The statistical analysis conducted on geographies consisting of 270,841,437 people shows a mild positive correlation between the proportion of Slavs and percentage of population with ambulatory disability in the United States with a correlation coefficient (R) of 0.378 and weighted average of 6.4%. Similarly, the statistical analysis conducted on geographies consisting of 584,325,810 people shows no correlation between the proportion of Nonimmigrants and percentage of population with ambulatory disability in the United States with a correlation coefficient (R) of 0.028 and weighted average of 6.9%, a difference of 7.8%.
Ambulatory Disability Correlation Summary
| Measurement | Slavic | Nonimmigrants |
| Minimum | 0.58% | 1.6% |
| Maximum | 56.8% | 20.4% |
| Range | 56.3% | 18.8% |
| Mean | 9.9% | 6.1% |
| Median | 7.4% | 5.8% |
| Interquartile 25% (IQ1) | 6.0% | 5.4% |
| Interquartile 75% (IQ3) | 10.2% | 6.2% |
| Interquartile Range (IQR) | 4.2% | 0.88% |
| Standard Deviation (Sample) | 8.9% | 1.9% |
| Standard Deviation (Population) | 8.8% | 1.9% |
Similar Demographics by Ambulatory Disability
Demographics Similar to Slavs by Ambulatory Disability
In terms of ambulatory disability, the demographic groups most similar to Slavs are Honduran (6.3%, a difference of 0.27%), Cuban (6.4%, a difference of 0.33%), Portuguese (6.4%, a difference of 0.34%), Czechoslovakian (6.4%, a difference of 0.39%), and Liberian (6.3%, a difference of 0.44%).
| Demographics | Rating | Rank | Ambulatory Disability |
| Indonesians | 9.9 /100 | #219 | Tragic 6.3% |
| Immigrants | Albania | 9.6 /100 | #220 | Tragic 6.3% |
| Hungarians | 9.6 /100 | #221 | Tragic 6.3% |
| German Russians | 9.4 /100 | #222 | Tragic 6.3% |
| Immigrants | Honduras | 7.6 /100 | #223 | Tragic 6.3% |
| Liberians | 7.1 /100 | #224 | Tragic 6.3% |
| Hondurans | 6.3 /100 | #225 | Tragic 6.3% |
| Slavs | 5.1 /100 | #226 | Tragic 6.4% |
| Cubans | 4.0 /100 | #227 | Tragic 6.4% |
| Portuguese | 4.0 /100 | #228 | Tragic 6.4% |
| Czechoslovakians | 3.8 /100 | #229 | Tragic 6.4% |
| Mexicans | 3.5 /100 | #230 | Tragic 6.4% |
| Panamanians | 3.1 /100 | #231 | Tragic 6.4% |
| Assyrians/Chaldeans/Syriacs | 2.4 /100 | #232 | Tragic 6.4% |
| Sub-Saharan Africans | 2.3 /100 | #233 | Tragic 6.4% |
Demographics Similar to Nonimmigrants by Ambulatory Disability
In terms of ambulatory disability, the demographic groups most similar to Nonimmigrants are Immigrants from Dominica (6.9%, a difference of 0.14%), Scotch-Irish (6.9%, a difference of 0.17%), U.S. Virgin Islander (6.8%, a difference of 0.27%), West Indian (6.9%, a difference of 0.27%), and Cheyenne (6.9%, a difference of 0.33%).
| Demographics | Rating | Rank | Ambulatory Disability |
| Yaqui | 0.0 /100 | #281 | Tragic 6.8% |
| Barbadians | 0.0 /100 | #282 | Tragic 6.8% |
| Immigrants | Barbados | 0.0 /100 | #283 | Tragic 6.8% |
| Immigrants | Jamaica | 0.0 /100 | #284 | Tragic 6.8% |
| Fijians | 0.0 /100 | #285 | Tragic 6.8% |
| Yakama | 0.0 /100 | #286 | Tragic 6.8% |
| U.S. Virgin Islanders | 0.0 /100 | #287 | Tragic 6.8% |
| Immigrants | Nonimmigrants | 0.0 /100 | #288 | Tragic 6.9% |
| Immigrants | Dominica | 0.0 /100 | #289 | Tragic 6.9% |
| Scotch-Irish | 0.0 /100 | #290 | Tragic 6.9% |
| West Indians | 0.0 /100 | #291 | Tragic 6.9% |
| Cheyenne | 0.0 /100 | #292 | Tragic 6.9% |
| Immigrants | St. Vincent and the Grenadines | 0.0 /100 | #293 | Tragic 6.9% |
| Cape Verdeans | 0.0 /100 | #294 | Tragic 6.9% |
| Crow | 0.0 /100 | #295 | Tragic 6.9% |