Slavic vs Belgian Male Poverty
COMPARE
Slavic
Belgian
Male Poverty
Male Poverty Comparison
Slavs
Belgians
10.5%
MALE POVERTY
91.7/ 100
METRIC RATING
103rd/ 347
METRIC RANK
10.3%
MALE POVERTY
95.9/ 100
METRIC RATING
81st/ 347
METRIC RANK
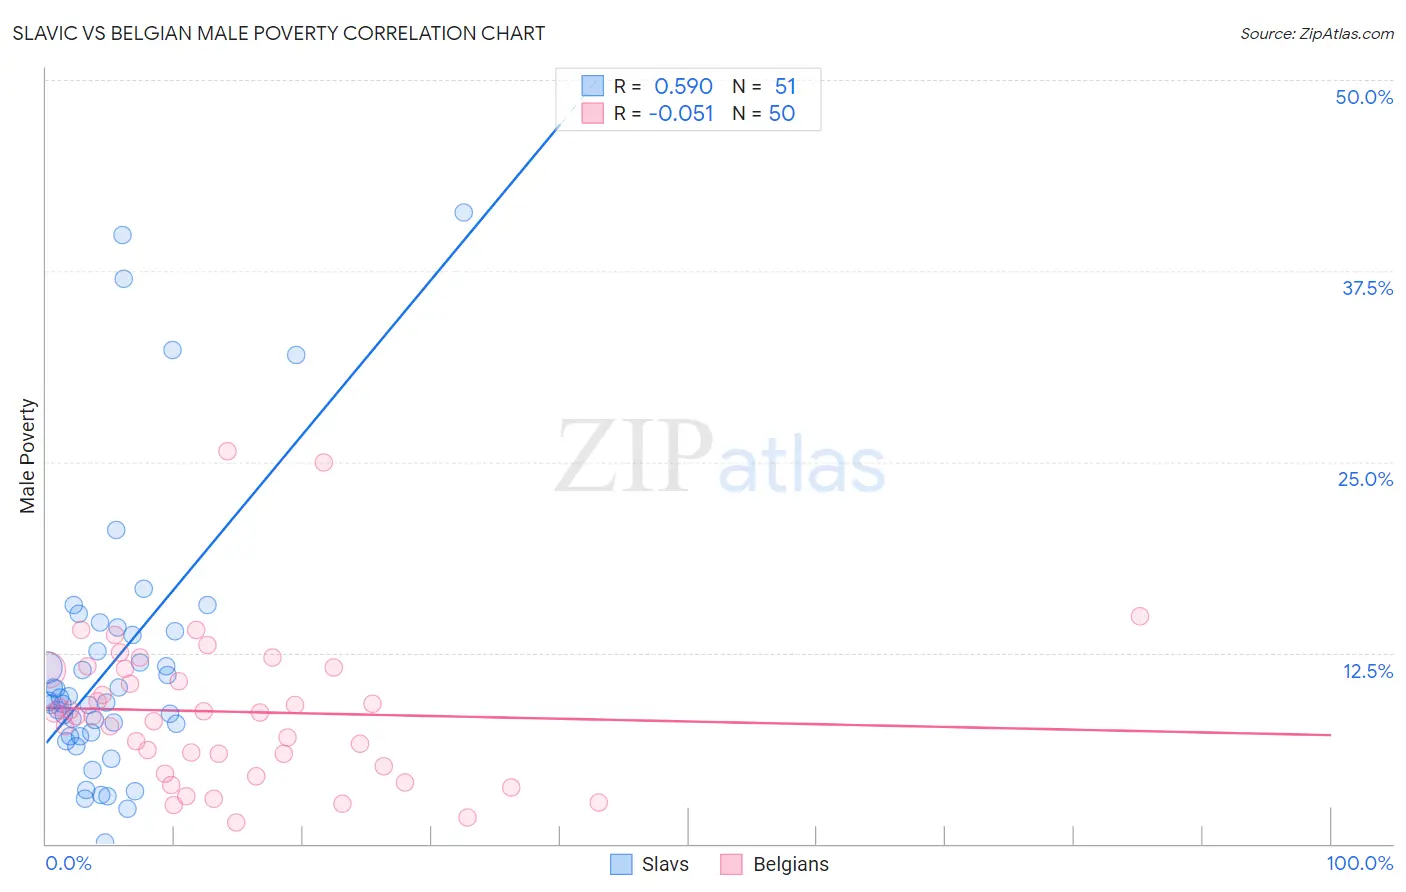
Slavic vs Belgian Male Poverty Correlation Chart
The statistical analysis conducted on geographies consisting of 270,742,219 people shows a substantial positive correlation between the proportion of Slavs and poverty level among males in the United States with a correlation coefficient (R) of 0.590 and weighted average of 10.5%. Similarly, the statistical analysis conducted on geographies consisting of 355,745,513 people shows a slight negative correlation between the proportion of Belgians and poverty level among males in the United States with a correlation coefficient (R) of -0.051 and weighted average of 10.3%, a difference of 2.0%.
Male Poverty Correlation Summary
| Measurement | Slavic | Belgian |
| Minimum | 0.066% | 1.4% |
| Maximum | 41.3% | 25.7% |
| Range | 41.2% | 24.3% |
| Mean | 11.9% | 8.6% |
| Median | 9.3% | 8.5% |
| Interquartile 25% (IQ1) | 7.0% | 5.1% |
| Interquartile 75% (IQ3) | 13.9% | 11.4% |
| Interquartile Range (IQR) | 6.9% | 6.4% |
| Standard Deviation (Sample) | 9.2% | 5.0% |
| Standard Deviation (Population) | 9.1% | 4.9% |
Similar Demographics by Male Poverty
Demographics Similar to Slavs by Male Poverty
In terms of male poverty, the demographic groups most similar to Slavs are Welsh (10.5%, a difference of 0.010%), Canadian (10.5%, a difference of 0.020%), French Canadian (10.5%, a difference of 0.10%), Immigrants from Zimbabwe (10.5%, a difference of 0.11%), and Immigrants from Southern Europe (10.5%, a difference of 0.13%).
| Demographics | Rating | Rank | Male Poverty |
| Immigrants | Egypt | 93.7 /100 | #96 | Exceptional 10.4% |
| Romanians | 93.6 /100 | #97 | Exceptional 10.5% |
| Finns | 93.4 /100 | #98 | Exceptional 10.5% |
| Immigrants | Indonesia | 93.3 /100 | #99 | Exceptional 10.5% |
| Immigrants | Latvia | 92.8 /100 | #100 | Exceptional 10.5% |
| Immigrants | Zimbabwe | 92.0 /100 | #101 | Exceptional 10.5% |
| French Canadians | 91.9 /100 | #102 | Exceptional 10.5% |
| Slavs | 91.7 /100 | #103 | Exceptional 10.5% |
| Welsh | 91.6 /100 | #104 | Exceptional 10.5% |
| Canadians | 91.6 /100 | #105 | Exceptional 10.5% |
| Immigrants | Southern Europe | 91.3 /100 | #106 | Exceptional 10.5% |
| Laotians | 91.2 /100 | #107 | Exceptional 10.5% |
| Portuguese | 91.0 /100 | #108 | Exceptional 10.6% |
| Albanians | 90.6 /100 | #109 | Exceptional 10.6% |
| Argentineans | 90.1 /100 | #110 | Exceptional 10.6% |
Demographics Similar to Belgians by Male Poverty
In terms of male poverty, the demographic groups most similar to Belgians are Egyptian (10.3%, a difference of 0.0%), Immigrants from Sweden (10.3%, a difference of 0.13%), Czechoslovakian (10.3%, a difference of 0.19%), Immigrants from England (10.4%, a difference of 0.24%), and Immigrants from Eastern Asia (10.4%, a difference of 0.37%).
| Demographics | Rating | Rank | Male Poverty |
| Immigrants | Eastern Europe | 96.9 /100 | #74 | Exceptional 10.2% |
| Carpatho Rusyns | 96.9 /100 | #75 | Exceptional 10.2% |
| Dutch | 96.9 /100 | #76 | Exceptional 10.2% |
| Immigrants | Belgium | 96.8 /100 | #77 | Exceptional 10.3% |
| Irish | 96.8 /100 | #78 | Exceptional 10.3% |
| Immigrants | North America | 96.5 /100 | #79 | Exceptional 10.3% |
| English | 96.4 /100 | #80 | Exceptional 10.3% |
| Belgians | 95.9 /100 | #81 | Exceptional 10.3% |
| Egyptians | 95.9 /100 | #82 | Exceptional 10.3% |
| Immigrants | Sweden | 95.7 /100 | #83 | Exceptional 10.3% |
| Czechoslovakians | 95.6 /100 | #84 | Exceptional 10.3% |
| Immigrants | England | 95.5 /100 | #85 | Exceptional 10.4% |
| Immigrants | Eastern Asia | 95.3 /100 | #86 | Exceptional 10.4% |
| Northern Europeans | 95.2 /100 | #87 | Exceptional 10.4% |
| Cambodians | 95.0 /100 | #88 | Exceptional 10.4% |